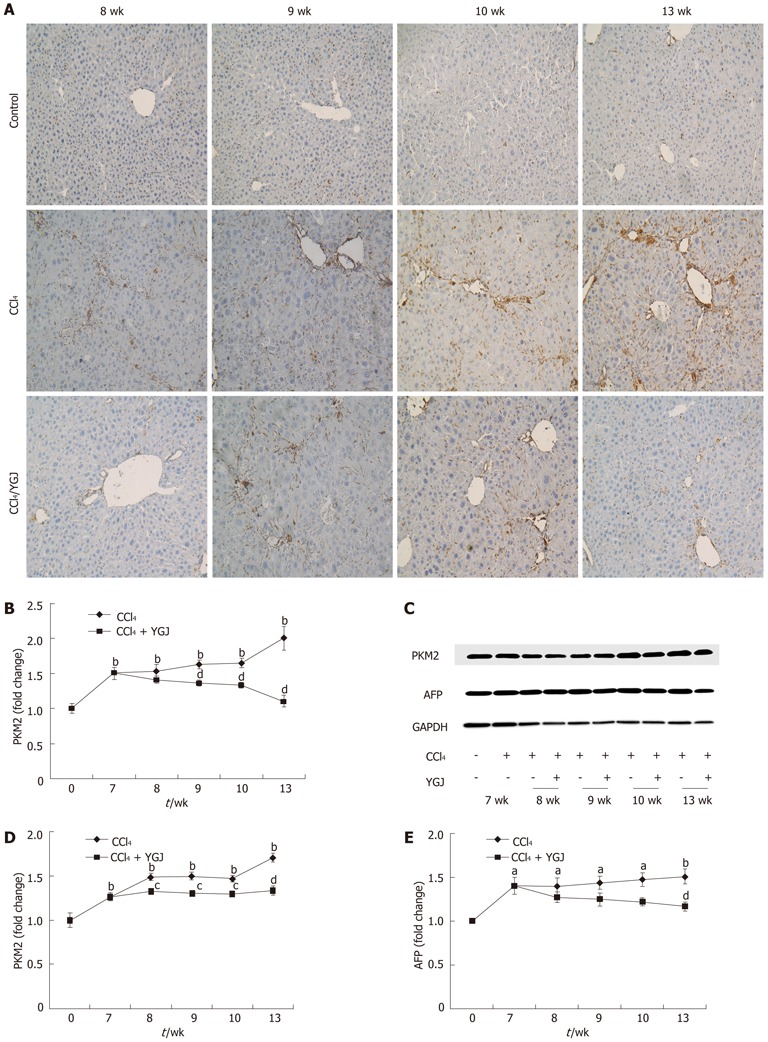
Figure 9.

Expression of progenitor markers in liver tissues. A: PKM2 immunostaining, × 200; B: Semi-quantification of PKM2 staining, with the week 0 control group level as the basal level; C: PKM2 and AFP Western blotting bands; D: Semi-quantification of PKM2 in Western blotting results, with the week 0 control group level as the basal level; E: Semi-quantification of Western blotting results of PKM2, with the week 0 control group level as the basal level. aP < 0.05, bP < 0.01 vs week 0 control group; cP < 0.05, dP < 0.01 vs the same time-point CCl4 group. Results are presented as mean ± SD. GAPDH: Glyceraldehydes-3-phosphate dehydrogenase; YGJ: Yiguanjian; PKM2: Mitogen-activated protein kinase-2; AFP: α fetoprotein.
