Figure 1.

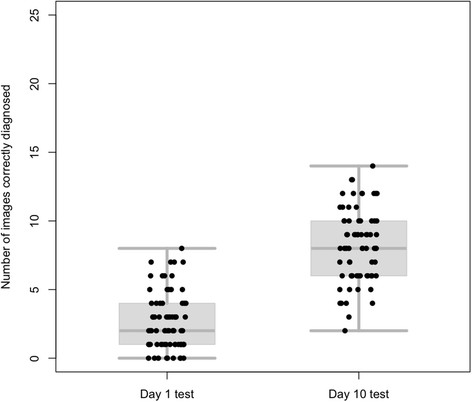
Combined box-plots and scatter plots showing all the test scores for students completing the Day 1 test (n=74, median=2) and the Day 10 test (n=70, median=8).

Combined box-plots and scatter plots showing all the test scores for students completing the Day 1 test (n=74, median=2) and the Day 10 test (n=70, median=8).