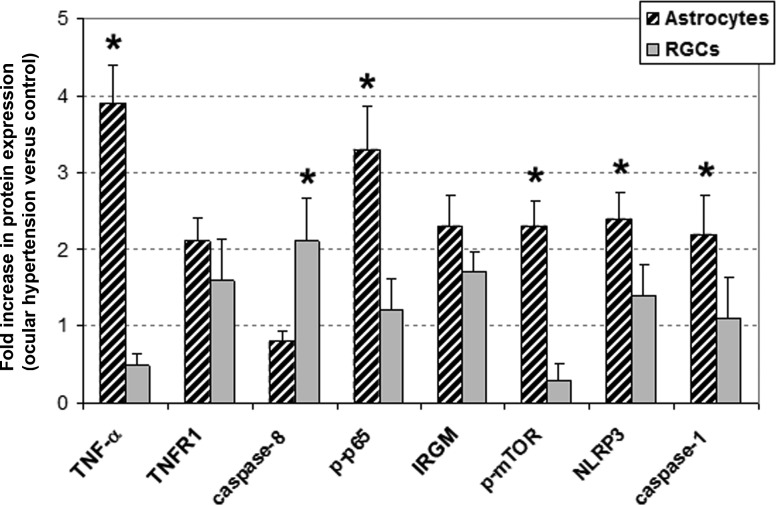
Figure 6. .
Quantitative Western blot analysis of protein expression in cell-specific samples. Comparison of the beta-actin-normalized intensity values between OHT and control samples supported distinct responses of astrocytes and RGCs. Data represent three independent sets of analyses with different samples. Presented is the mean ± SD fold increase in protein expression, which was determined by comparing the actin-normalized densitometry values of specific immunoreactive bands in OHT samples with those of normotensive controls. Asterisk indicates statistically significant difference between astrocyte and RGC responses (Mann-Whitney rank sum test, P < 0.05).

