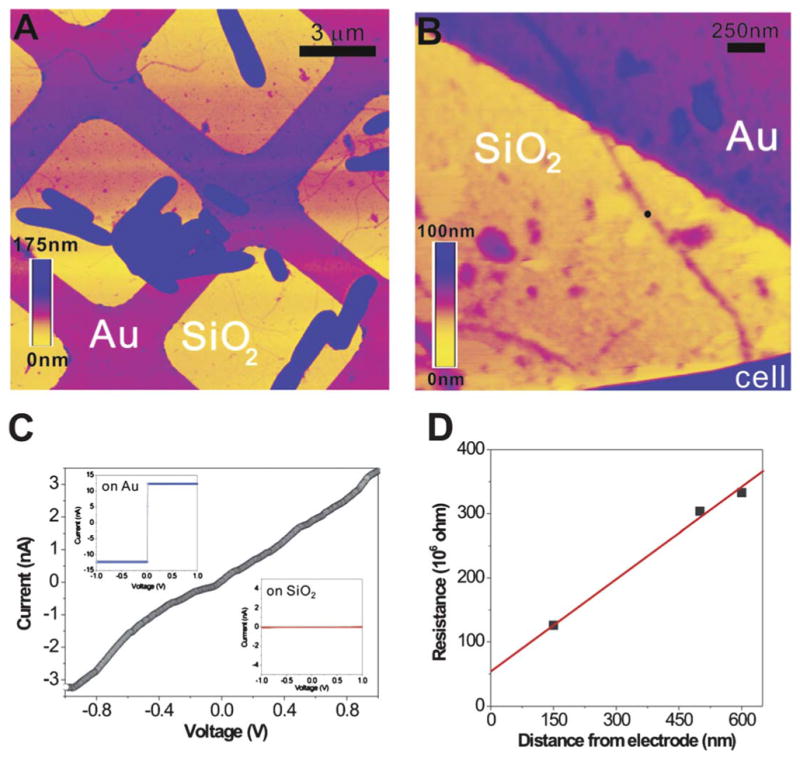
Fig. 3.

CP-AFM of a bacterial nanowire.8 (A) Topographic AFM image showing air-dried S. oneidensis MR-1 cells and extracellular appendages deposited randomly on a SiO2/Si substrate patterned with Au microgrids. (B) Contact mode AFM image showing a nanowire reaching out from a bacterial cell to the Au electrode. (C) An I–V curve obtained by probing the nanowire at a length of 600 nm away from the Au electrode (at the position marked by the black dot in B). (Inset) The I–V curves obtained on bare Au and SiO2, respectively. (D) A plot of total resistance as a function of distance between CP-AFM tip and the Au electrode. Figure reproduced with permission. Copyright (2010) National Academy of Sciences, U.S.A.
