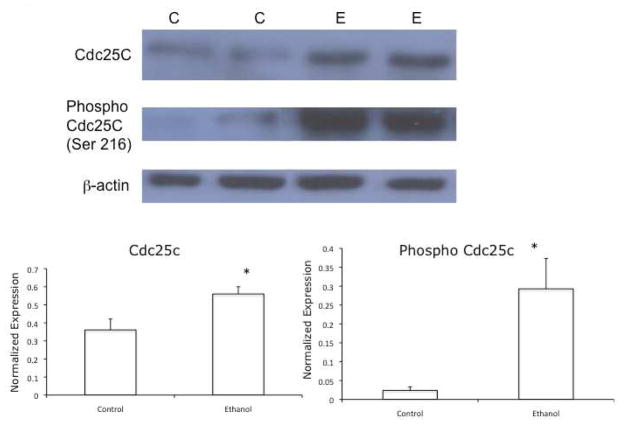
Figure 1.
Effects of ethanol metabolism on the expression of Cdc25C and Ser 216-phosphorylated Cdc25C. VA-13 cells were cultured in the presence or absence of 25 mM ethanol for 4 days, the cells were lysed, and analyzed by immunoblot for total and Ser 216-phosphorylated Cdc25C. Densitometry indicated approximately a 1.5-fold increase in Cdc25C and approximately a 10-fold increase in Ser 216-phosphorylated Cdc25C in cells cultured in the presence of ethanol, when normalized with b-actin. The blot is representative of at least three experiments. Error bars indicate the standard error of the mean *P ≤ 0.05. C: control, E: ethanol treated

