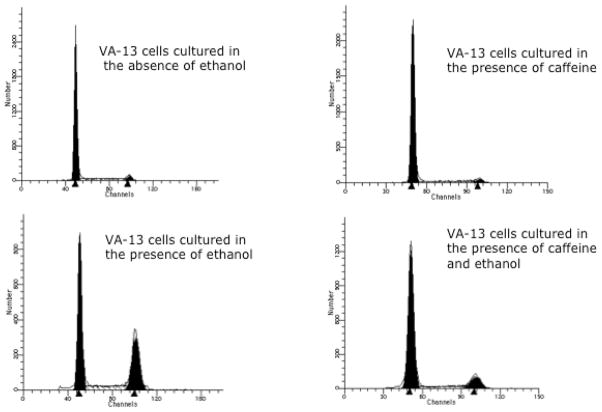
Figure 6.
Cell cycle analysis. Cells were cultured in the presence or absence of 25 mM ethanol and 1 mM caffeine for 4 days, stained with Vindelov’s reagent, and analyzed by flow cytometry. Approximately 4% of untreated controls and cells cultured in the presence of caffeine were in the G2/M transition of the cell cycle. Whereas, approximately 33% of the cells cultured in the presence of ethanol were in G2/M. Inclusion of caffeine in the ethanol containing media dramatically reduced the percentage of cells in G2/M to approximately 12%.

