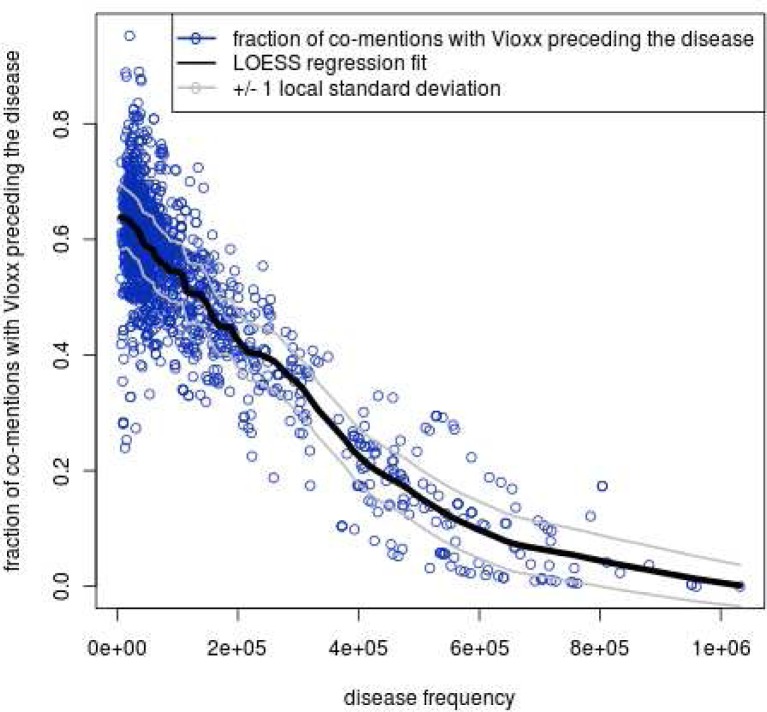
Figure 5.
LOESS provides a baseline (e.g., Vioxx versus all diseases): for each disease Z, we plot on the x-axis the total count of patients whose record ever mentions disease Z. The y-axis is the drug-first fraction for Vioxx-Z. Predictably, common disease concepts, have lower baseline expected value for drug-first fraction. The local one standard deviation lines are also shown.

