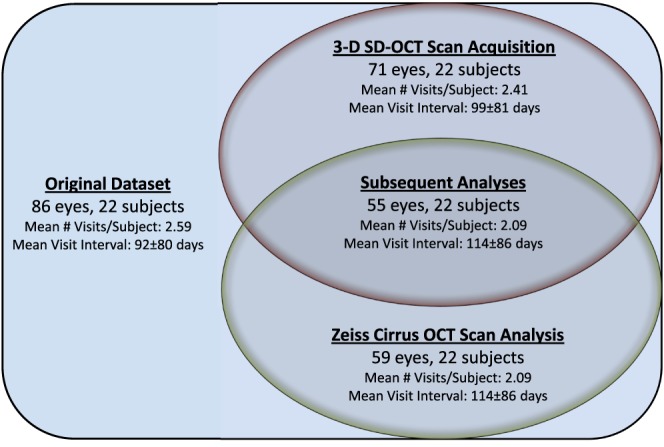
Figure 3. .

A Venn diagram showing the data used in the study's experiments. The original dataset included 86 SD-OCT volumes and fundus photographs from 22 subjects. The exclusion of 15 volumetric scans (due to an incompletely acquired ILM or RPE in the confines of the z-axis window) resulted in 71 volumetric SD-OCT volumes and fundus photographs from 22 subjects (indicated in red). This dataset was used for the first part of the study analyses. From the original dataset, the exclusion of 27 SD-OCT volumes due to the obvious failure of the SD-OCT scanner RNFL algorithm resulted in 59 volumetric SD-OCT volumes and fundus photographs from 22 subjects (indicated in green). This dataset was not directly used in the study analyses. The intersection of these two datasets (labeled “Subsequent Analyses”) resulted in 55 SD-OCT volumes and fundus photographs from 22 subjects. This dataset was used for the remaining analyses. For each dataset, the mean number of visits per subject and mean time interval (± standard deviation) between visits is also shown.
