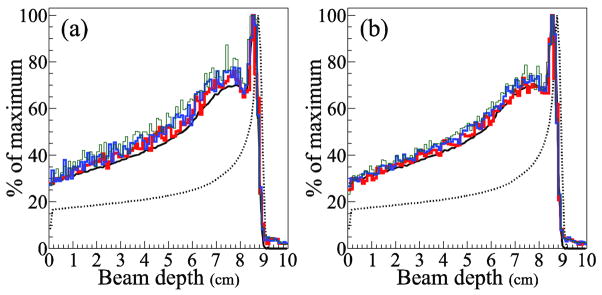
Figure 4.
1D projections of the gamma origin distribution along the beam central axis for (a) 1M and (b) 4M gammas. The MC dose (dotted line) and gamma origin (solid line) distributions are shown in black. The SOE algorithm reconstructions used 10,000 iterations with VPP value 0.5 mm3 (thin green line), 1.0 mm3 (medium blue line), and 2.0 mm3 (thick red line). All curves and histograms are normalized to their maximum values.

