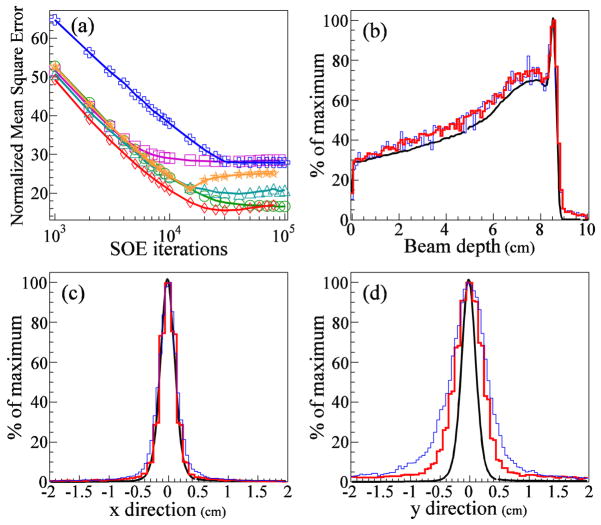
Figure 7.
(a) NMSE values versus number of iterations of the SOE algorithm for sets of 1M and 4M gammas. For each set, the algorithm was run with VPP values 0.5 mm3, 1.0 mm3, and 2.0 mm3. Results are shown for SOE reconstructions using the following numbers of gammas and voxel probability parameters, respectively: 1M and 2 mm3 (green circles), 4M and 2 mm3 (purple squares), 1M and 1 mm3 (cyan triangles), 4M and 1 mm3 (red diamonds), 1M and 0.5 mm3 (blue crosses), and 4M and 0.5 mm3 (orange stars). (b–d) 1D projection of the gamma origin distribution (b) along the beam central axis, (c) in the direction, and (d) in the direction. For (b), (c), and (d), the MC gamma origin distributions are shown in black, and the thin blue lines and thick red lines represent the SOE runs with the largest and smallest NMSE values, respectively, after 10,000 iterations. The SOE reconstruction with 1M gammas and VPP value 0.5 mm3 (thin blue line) has an NMSE value of 38. The SOE reconstruction using 4M gammas and VPP value 1.0 mm3 (thick red line) has an NMSE value of 21.

