Figure 2.
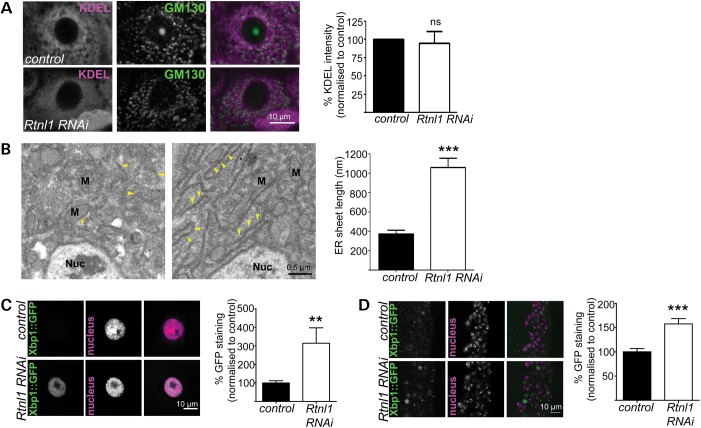
Loss of Rtnl1 causes expansion of ER sheets and increases the ER stress response. (A) KDEL distribution in third-instar larval epidermal cells is reticular in control larvae but more diffuse in Rtnl1 RNAi larvae; distribution of the Golgi marker GM130 is broadly unaffected. Graph shows KDEL staining intensity per cell as a percentage of control levels (n= 4 independent experiments; ns, not significant, P > 0.7). (B) Electron micrographs show increased length of ER sheets in Rtnl1 RNAi epidermal cells compared with controls. Arrowheads, ER sheets; Nuc, nucleus; M, mitochondrion. The graph shows the quantification of ER sheet cross-sectional length (***P < 0.005; n = 3 independent larvae). (C and D) Single-confocal sections of larval epidermal cells (C) and ventral nerve cord (D) show increased ER stress, measured by increased Xbp1::GFP expression in Rtnl1 RNAi larvae compared with controls and quantified in graphs (**P < 0.01, ***P < 0.005; n = 12–16).

