Figure 3.
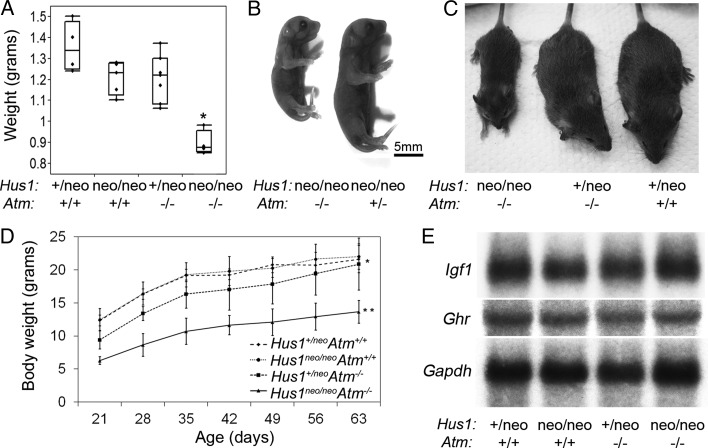
Dwarfism in Hus1neo/neoAtm−/− embryos and adult mice. (A) The box plot indicates the body weight of E18.5 embryos of the indicated genotypes (n≥ 4 per group). Hus1neo/neoAtm−/− embryos were significantly smaller than their littermates (P< 0.001, Student's t-test). (B) A representative image of newborn (P1) littermates of the indicated genotypes is shown. The scale bar represents 5 mm. (C) The photograph of 6-week-old male littermates of the indicated genotypes. (D) Body weight analysis of Hus1neo/neoAtm−/− mice and control littermates. The average body weights of female mice (n≥ 5 per genotype) of the indicated genotypes, from weaning to 9 weeks of age, are shown. The mean body weight was significantly lower for Hus1+/neoAtm−/− mice when compared with the Atm+/+ groups (*P< 0.05, mixed model analysis); Hus1neo/neoAtm−/− mice had significantly lower mean body weight when compared with all other groups (**P<0.01, mixed model analysis). (E) Northern blot analysis of transcript levels of Igf1 and Ghr in total RNA from the liver. Gapdh was used as a loading control.

