Figure 5.
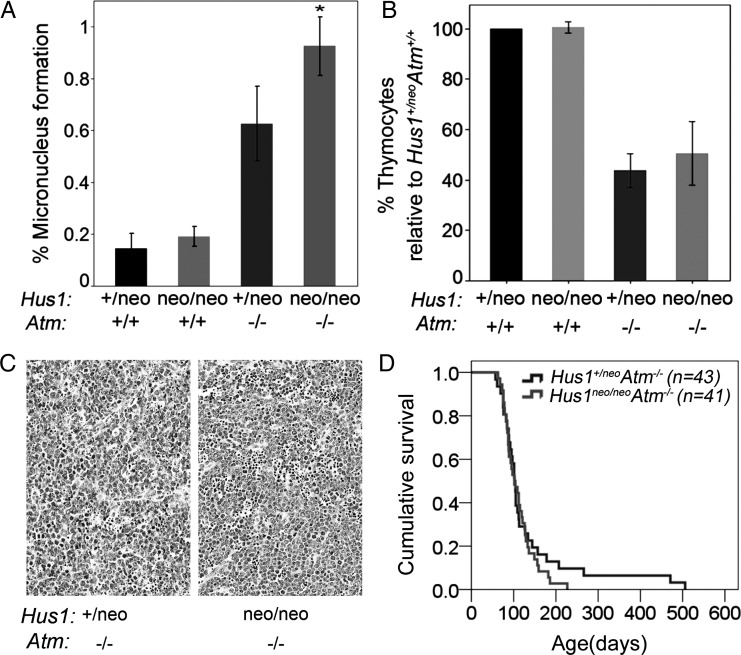
Increased genomic instability with no change in tumor predisposition in Hus1neo/neoAtm−/− mice. (A) The bar graph shows the average percentage of peripheral blood cells with MN in mice of the indicated genotypes. Hus1neo/neoAtm+/+ and Hus1+/neoAtm+/+ mice showed similar levels of GIN, whereas Hus1+/neoAtm−/− mice had a significant increase in MN formation (P< 0.001, Student's t-test). The combined effect of Hus1 impairment in an Atm null background (Hus1neo/neoAtm−/−) resulted in a greater than additive increase in GIN (P=0.002, univariate analysis of variance). (B) The bar graph shows the relative number of thymocytes in 6-week-old mice of the indicated genotypes (n≥3 per group) expressed as a percentage of the value for Hus1+/neoAtm+/+ control littermates. Error bars indicate standard deviation. The entire thymus from each mouse was harvested and mechanically disrupted, and viable trypan-blue-negative thymocytes were counted using a hemocytometer. The relative number of thymocytes was significantly lower for both Hus1+/neoAtm−/− and Hus1neo/neoAtm−/− mice (*P<0.001, Student's t-test). (C) Representative hematoxylin and eosin-stained sections of thymic lymphomas from Hus1+/neoAtm−/− (left) and Hus1neo/neoAtm−/− (right) mice. The scale bar represents 50 µm. (D) Cohorts of Hus1neo/neoAtm−/− (n=41) and Hus1+/neoAtm−/− (n=43) mice were monitored for tumor development as described in Materials and Methods. A Kaplan–Meier survival curve is shown. Overall survival was not significantly different between genotypes (P=0.644, log-rank test).

