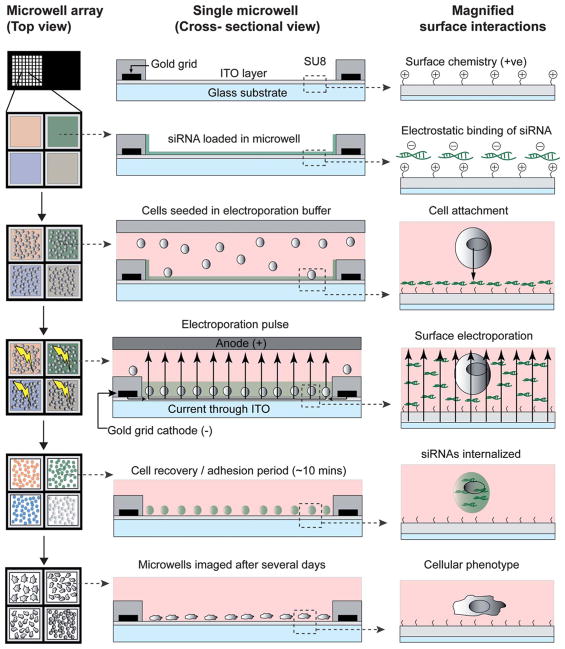
Fig. 1.
Schematic of the electroporation protocol in miniaturized electroporation-ready microwell arrays. Left column – top view of microwell array; Center column – cross-sectional view of a single microwell; Right column – magnified view of surface interactions. First row – microwell array consisting of an ITO-coated glass surface patterned with an electrode grid, which is further insulated by a pattern of thick photoresist (SU-8). The ITO layer is amine-functionalized to generate a positively charged surface. Second row – registered and multiplexed loading of nucleic acids (siRNA) into the microwell array. Negatively charged siRNAs electrostatically bind the positive surface. Third row – cell seeding onto the microwell array in electroporation buffer by sandwiching the plated volume at a precise distance from the bottom ITO surface. Cells attach to the bottom of the microwells and are in proximity to the bound siRNA. Fourth row – using the top sandwich electrode as an anode and the bottom ITO layer as the cathode, an electroporation pulse is applied to all microwells simultaneously. Current flows from the patterned electrode grid into the ITO layer and through the electroporation buffer. The microwell array material (SU-8) insulates the grid and prevents direct current flow into the buffer. Fifth row – cells are allowed to recover and strengthen attachment post-electroporation. Sixth row – the microwell array is incubated for the period of the assay and imaged for cellular phenotypes.

