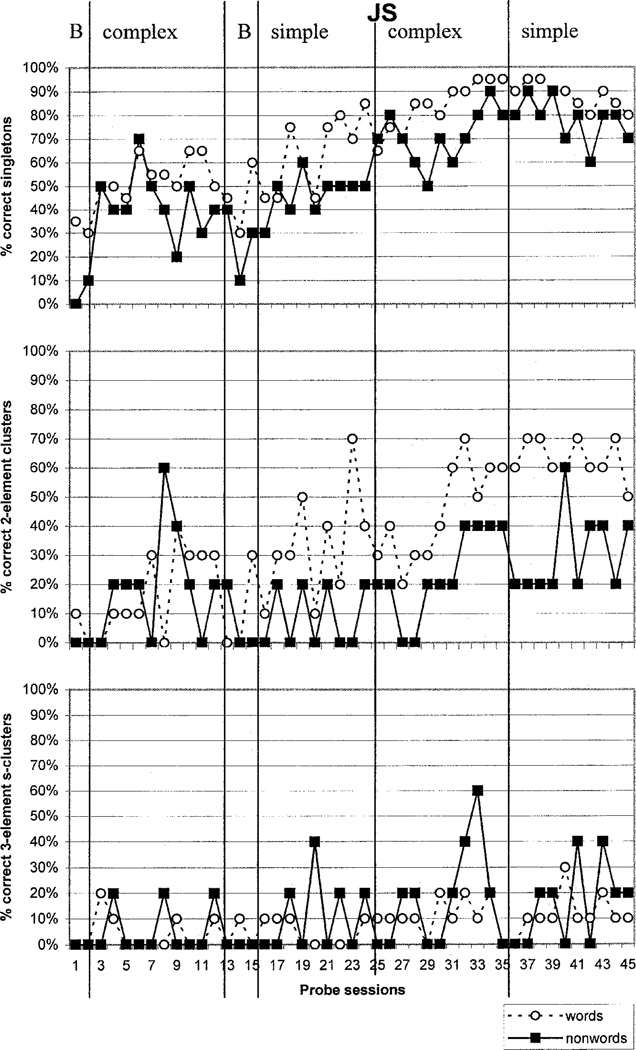
Figure 3.
Results for JS on the probe lists. The top figure represents singletons, the middle figure represents two-element clusters and the bottom figure represents three-element s-clusters. Filled squares indicate nonword probes; open circles indicate word probes. B = baseline sessions; complex = three-element s-cluster treatment; simple = singleton treatment. (Note: in the first, complex, treatment phase, an additional treatment session was inadvertently administered.)

