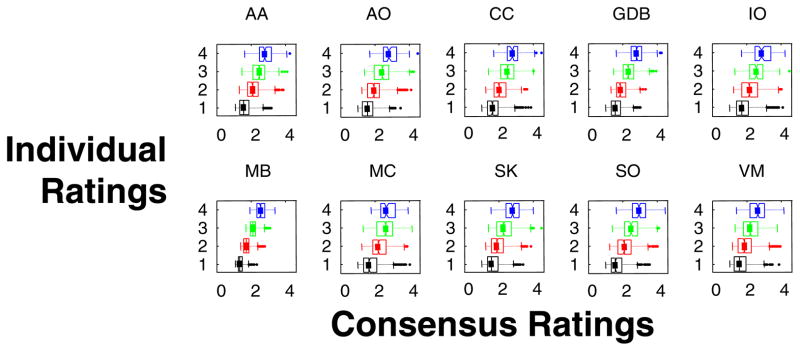
Fig. 3.
Correspondence of individual face ratings with the consensus ratings. For each of 10 raters (5 M, 5 F), boxplots indicate the distribution of consensus ratings for the images that the rater scored at each level of face-likeness, from 1 (least face-like) to 4 (most face-like). Consensus ratings for each image were determined by missing-data principal components analysis (see the Method section)

