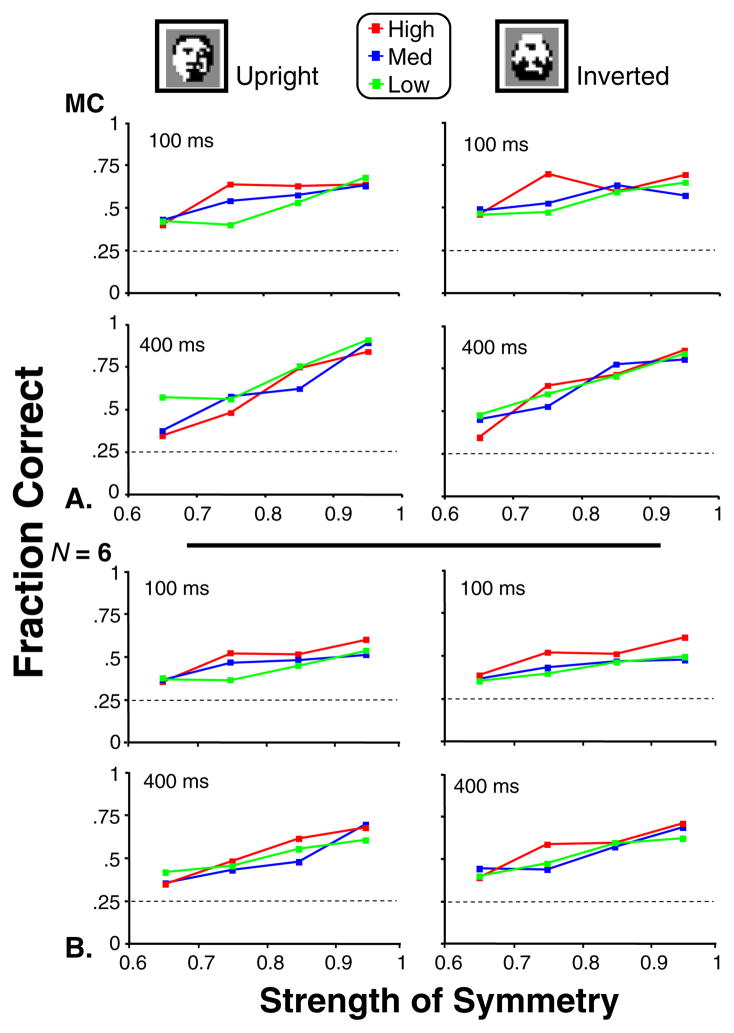
Fig. 6.
Performance in Experiment 1 for the low, medium, and high bands of face-likeness. Fraction correct is plotted as a function of symmetry strength for participant M.C. (Panel a) and is averaged across the six particpants (Panel b). Dotted lines represent chance performance level. Standard errors are approximately 0.06 (one participant) and 0.025 (N = 6), via binomial statistics. The abscissa labels correspond to ranges of values for symmetry: 0.6 to 0.7, 0.7 to 0.8, 0.8 to 0.9, and 0.9 to 1.0

