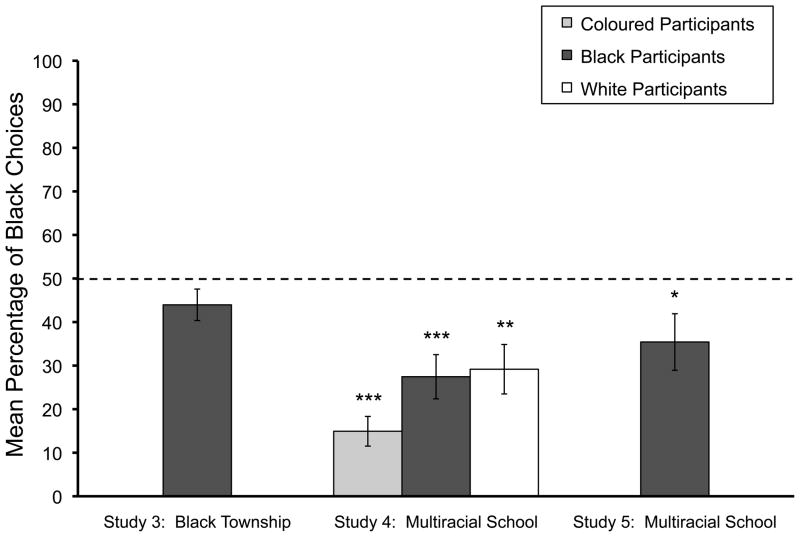
Figure 2.
Studies 3–5: Race preferences of Black children tested in a Black township, and of Coloured, Black, and White children tested in a multiracial school. The graphs show participants’ mean percentage choices of Black faces (as opposed to White faces). Error bars represent standard error and asterisks indicate bars that are significantly below chance according to one-sample t-tests (*** p < .001; ** p < .01; * p < .05). One-sample t-test values (left to right) are as follows: t(31) = −1.81, p = .08; t(35) = −10.29; t(22) = −4.45; t(14) = −3.67; t(11) = −2.24.

