
Figure 1. Activation of the PI3K pathway in a panel of HMCL representing the major non-hyperdiploid IgH translocation subtypes.
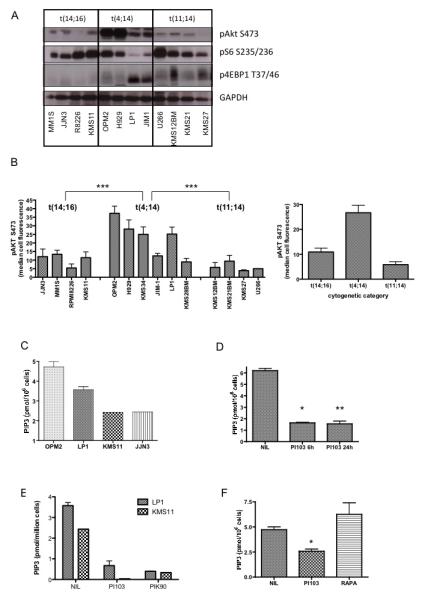
A. Lysates from a selection of HMCL were immunoblotted with the indicated antibodies. The translocation subtypes are labelled above the top panel. The KMS11 cell line is positive for both t(14;16) and t(4;14).
B. Akt phosphorylation at serine 473 was quantified by flow cytometry in the individual indicated cell lines (mean ± SEM of replicates of at least 3 separate experiments for each cell line). Akt phosphorylation was significantly higher in t(4;14) cells compared with either t(14;16) (p=0.0003 by Mann-Whitney test) or t(11;14) cells (p-0.0002). The difference between t(14;16) and t(11;14) cells was of borderline statistical significance (p=0.06). Pooled data for all the cell lines in each cytogenetic category is shown in the right hand panel.
C – F. Cell extracts were analysed for PIP3 levels by ELISA.
C. Steady state PIP3 levels in two t(4;14) cell lines (OPM2 and LP1) and two t(14:16) cell lines (KMS11, JJN3) were measured.
D. OPM2 cells were incubated with 1uM PI103 for the indicated times and PIP3 measured.
E. KMS11 and LP1 cells were incubated with either 1uM PI103 or 1uM PIK90 for 6 hours and residual PIP3 levels measured.
F. OPM2 cells were incubated with 1uM PI103 or 20nM Rapamycin for 6 hours and residual PIP3 levels measured.