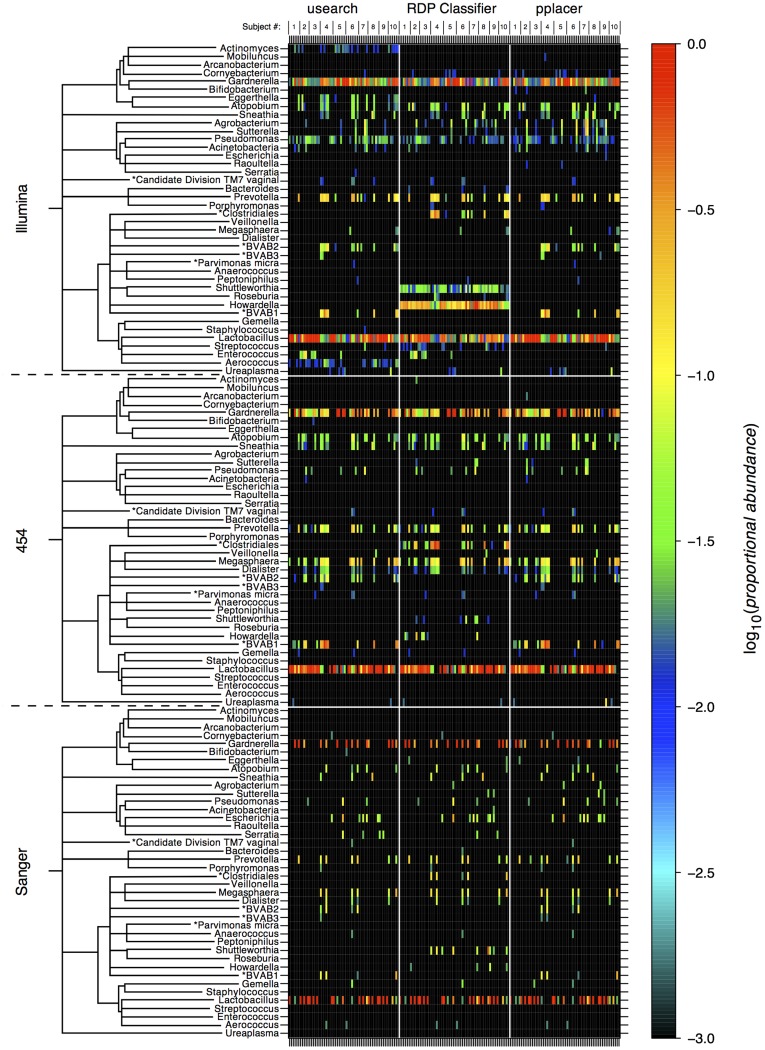
Figure 3. Community compositions of cervical samples at the genus level as determined by 9 different methodological configurations.
Heat-maps show the log10 (proportional abundance) of each bacterial genus detected in each clinical sample for each methodological combination. In the 3×3 grid of heat-maps, the sequencing method is indicated at the far left and the classification software is indicated at the top of the panels. The cladograms to the left of the genus names indicate the approximate evolutionary relationships between genera.

