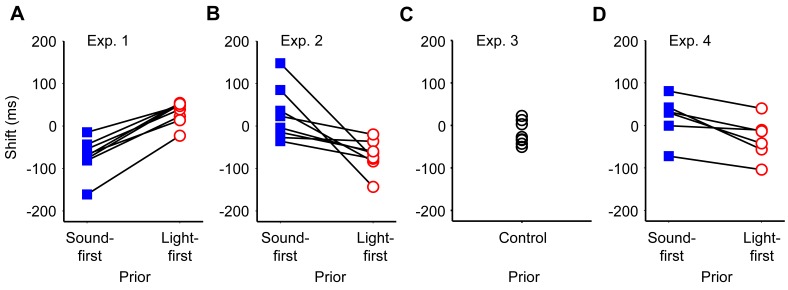
Figure 3. Shifts in the point of simultaneity calculated for each individual participants.
Each panel shows data from Experiment 1 (A), 2 (B), 3 (C), and 4 (D). Note that all participants yielded data in agreement with lag adaptation in Experiment 1 (A), but all participants yielded those in agreement with Bayesian calibration in Experiment 2 (B) and 4 (D).

