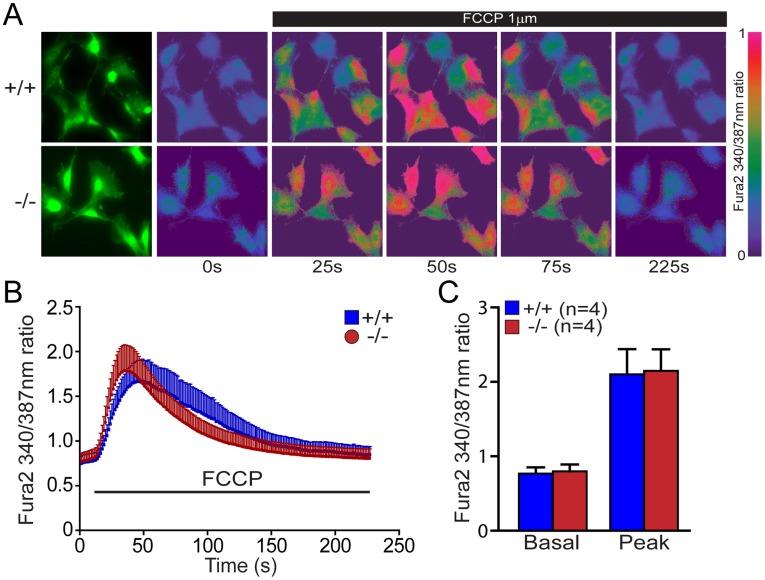
Figure 6. Normal levels of mitochondrial calcium in DJ-1−/− cells.
(A) Representative Fura-2 images of Ca2+ responses following FCCP treatment in DJ-1−/− and +/+ MEFs. Fura-2 ratios at 340/387 are shown at time points indicated. The green fluorescence images show the shape of the DJ-1−/− and +/+ MEFs. The pseudocolor calibration scale for 340/387 ratios is shown on the right. FCCP (1 µM) was added at t = 25 s. (B) Time course of cytosolic [Ca2+] rise following FCCP treatment in DJ-1−/− and +/+ MEFs. (C) The basal and the peak value of cytosolic calcium rise following FCCP are the same in DJ-1−/− and +/+ MEFs. The number shown in the panel indicates the number of embryos used to derive primary MEFs, and the data were obtained from three independent experiments. All data are expressed as mean ± SEM.

