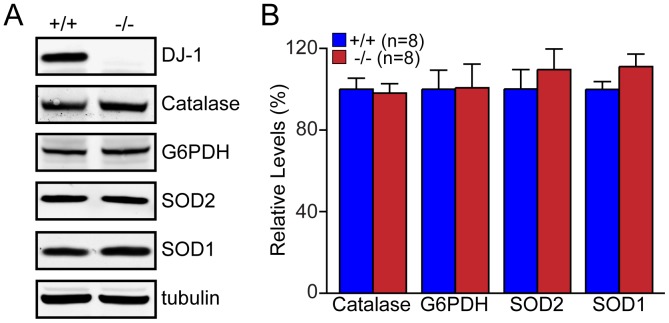
Figure 8. Normal levels of antioxidant proteins in DJ-1−/− MEFs.
(A) Representative western blot showing expression levels of Catalase, G6PDH, SOD1 and SOD2. Tubulin was used as loading control. (B) The bar graph shows the quantification of the level of each protein normalized to tubulin. The number shown in the panel indicates the number of embryos used to derive primary MEFs per genotype, and the data were obtained from three independent experiments. All data are expressed as mean ± SEM.

