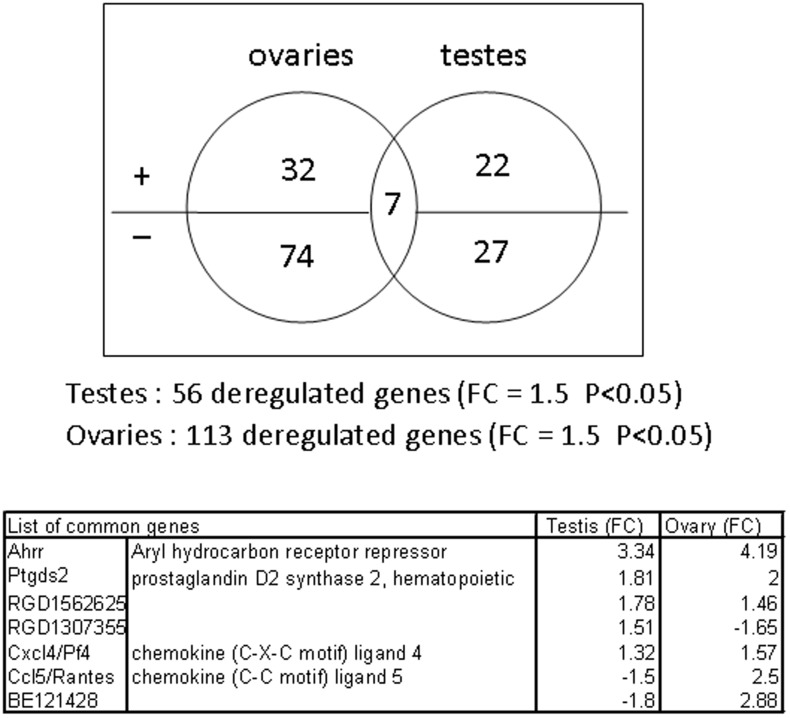
Figure 1. TCDD-regulated genes detected by microarrays in ovaries and testes.
Genes were selected on the basis of a p-value<0.05 and a 1.5 fold change factor of mRNA expression in response to TCDD. The Venn diagram illustrates the repartition between genes up- and down-regulated in testes or ovaries, and the 7 genes both regulated in testes and ovaries are listed.

