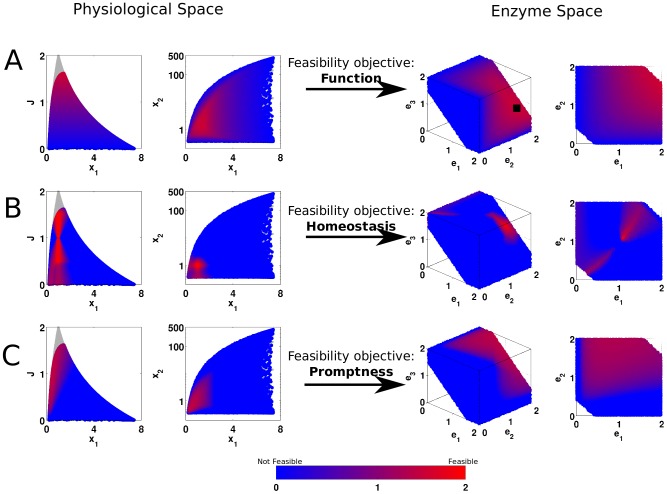
Figure 4. Feasibility analysis for the toy problem.
The first two columns are the physiological space (first colum: flux vs.  , second column:
  vs
vs  ), and the last two columns are the enzyme space (third column: viable enzyme space with all enzymes, fourth column: selected 2D slices from the third column at
  ). fig:FluxFeasToy: Optimal flux as feasibility criterion for function. fig:HomeostasisFeasToy: Homeostasis of the both metabolites as feasibility criterion. fig:PromptFeasToy: Turn-over time as feasibility criterion for temporal responsiveness. The red-blue color gradient indicates continuous values for the feasibility criteria in consideration, red indicates feasible states while blue indicates infeasible states The feasibility criteria are
  , for function, homeostasis and temporal responsiveness respectively. The quantitative measures for homeostasis and temporal responsiveness have been changed sign and added offset for visualization purposes. The gray points in the physiological states are those for which the corresponding enzyme levels are outside the viable range, after applying the constraints. All axes in all plots are presented relative to their reference state, and
  is presented in logarithmic scale.

