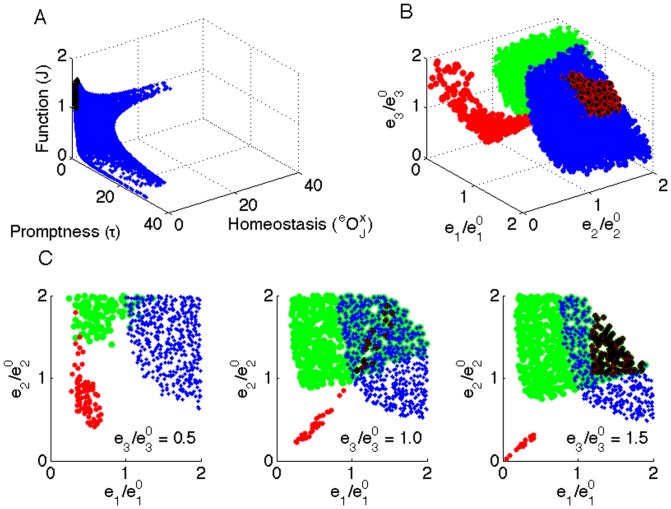
Figure 5. Combining feasibility criteria.
fig:ObjSpace represents the objective space, where each feasibility criterion is taken along (no cutoff is used in this plot). fig:CombinedObj presents a 3D plot of the feasible enzyme space fig:CombinedObjLayers presents decompositions of the feasible enzyme space into a series of 2D slices, each differing by the value of  (indicated on the plot). Blue points describe the functionally feasible enzyme levels (
 i.e. fluxes with top 25% are considered as feasible), red points are homeostatically feasible enzyme levels (
 ), green points are the feasible enzyme levels considering the temporal responsiveness and black points are the states that are feasible for all three criteria.

