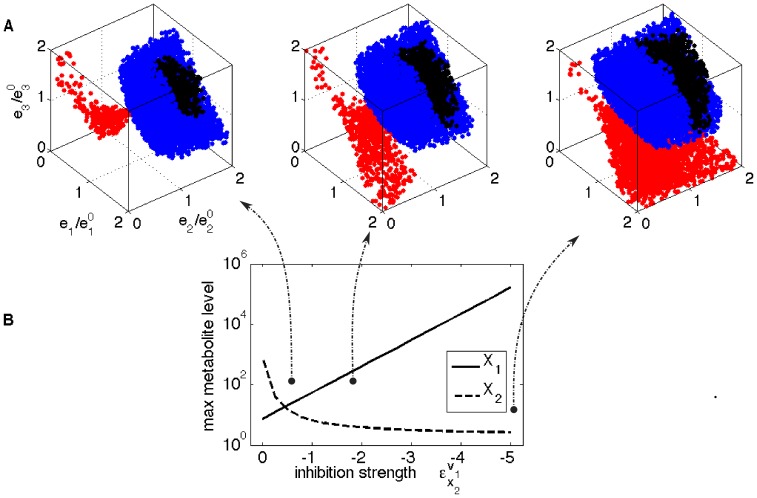
Figure 6. The effect of additional feedback inhibition of .
 on
on
 on the feasible enzyme space with respect to homeostasis (
 ) and function (
 ). fig:HomeostasisEv1x2: The feasible enzyme space for
  (left),
  (center), and
  (right). In every subplot, red points: solely homeostatically feasible enzyme levels; blue points: solely functionally feasible enzyme levels; black points: feasible enzyme levels on both criteria. The axes for all 3 plots are the same, enzyme levels relative to the reference state. fig:AdditionalFeedbackEv1x2-MetLev: The maximum achievable metabolite levels as function of the inhibition strength.

