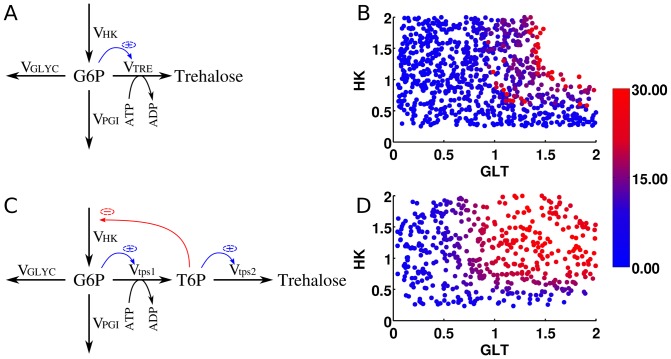
Figure 9. The danger of Turbo design and a potential solution investigated using FA.
fig:TurboDesignAnalysisA: The original model considered in [24]. fig:TurboDesignAnalysisB: The feasible regulatory space of relative enzyme activities of HK and GLT. Increasing the enzyme levels leads to infeasible states for hexoses (red points on the upper right corner on the plot). fig:TurboDesignAnalysisD: The new design of the system with added metabolite T6P and its inhibition on HK. The new model parameters for storage branch are:  . fig:TurboDesignAnalysisE: the same regulatory space as in fig:TurboDesignAnalysisB after addition of the feedback inhibition of T6P on HK. In fig:TurboDesignAnalysisA and fig:TurboDesignAnalysisD, only interactions within the focus are shown for simplicity where blue arrows indicate the kinetic activation and red arrow indicates inhibition. In fig:TurboDesignAnalysisB and fig:TurboDesignAnalysisE, only HK and GLT are monitored, remaining enzymes are held at their reference levels. The color code used in plots fig:TurboDesignAnalysisB and fig:TurboDesignAnalysisE is the co-response coefficient
  .
.

