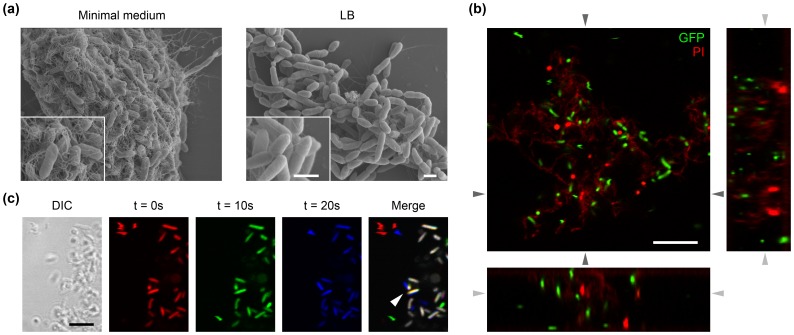
Figure 4. A fibrillar matrix produced in vitro by P. syringae pv. aesculi enwraps aggregates of immobilized bacteria.
(A) After incubation in minimal medium a fibrillar material covering clustered bacterial cells is observed by scanning electron microscopy (left-hand panel). Such material is not encountered after incubation in LB, wherein only the polar flagella are observed extracellularly (right-hand panel). The insets show the bacterial cells and the surrounding material in more detail. Note that due to the completely dehydrated state of the specimen, the here presented image likely does not depict the true spatial lay-out of a bacterial cluster. The scale bars indicate 1 µm. (B) A typical cluster observed in a PD4818-pMP4655 culture grown in minimal medium visualized by confocal laser scanning microscopy. GFP-expressing bacteria appear in green, while addition of propidium iodide (PI) brightly stained dead individuals red and led to a mild staining of the amorphous material enwrapping the bacteria within a cluster. The bottom and right panels are computed images of the two orthogonal planes along the z-axis indicated by the dark grey arrows. The light grey arrows indicate the position of the optical plane shown in the top left panel. Note that single bacteria are spaced from neighbouring cells in 3 dimensions. The scale bars indicate 10 µm. (C) Three 10 second interval frames taken from a time-lapse movie of the edge of a PD4818-pMP4655 cluster (depicted in the DIC image) were differentially colour coded and merged to reveal displacement of individual bacteria over time. Several motile bacteria freely moved on the left appearing in a single colour in the merged image, while bacteria within the cluster remained at a fixed location as revealed by their white colour in the merged image. Additionally, oscillatory motion of 2 bacteria is discernable in the cluster margin (arrowhead), indicated by the slight colour shift. The scale bar indicates 5 µm.

