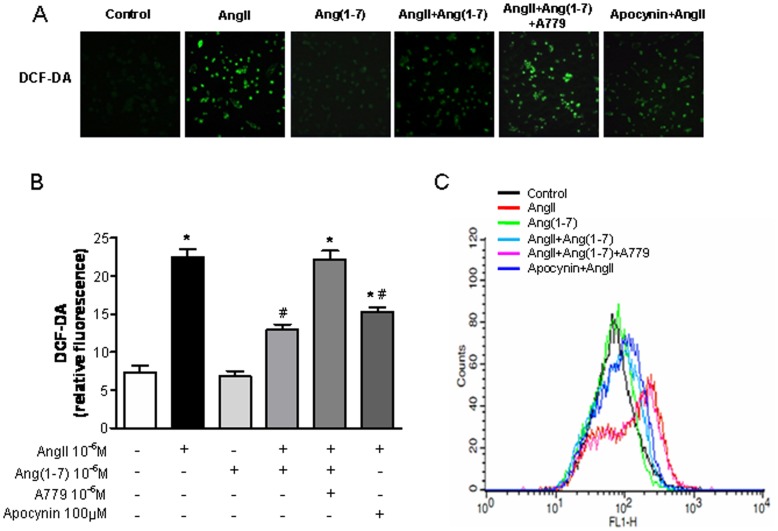
Figure 2. Effects of Ang-(1-7) on AngII-stimulated intracellular ROS production.
A, Confocal microscopic images of cells subjected to DCF-DA treatment. Cells were exposed to Ang II (10−6 M) for 24 h with or without Ang-(1-7) (10−6 M), A779 (10−6 M), and apocynin (100 µM). B Measurement of DCF-DA fluorescence intensity. C, Flow cytometric analysis of cells treated with DCF-DA after treatment with Ang-(1-7) plus Ang II, reflecting a reduction in ROS generation. Values are the mean ± S.E.M. (n = 4). *p<0.05 versus control; #p<0.05 versus Ang II-stimulated cells.

