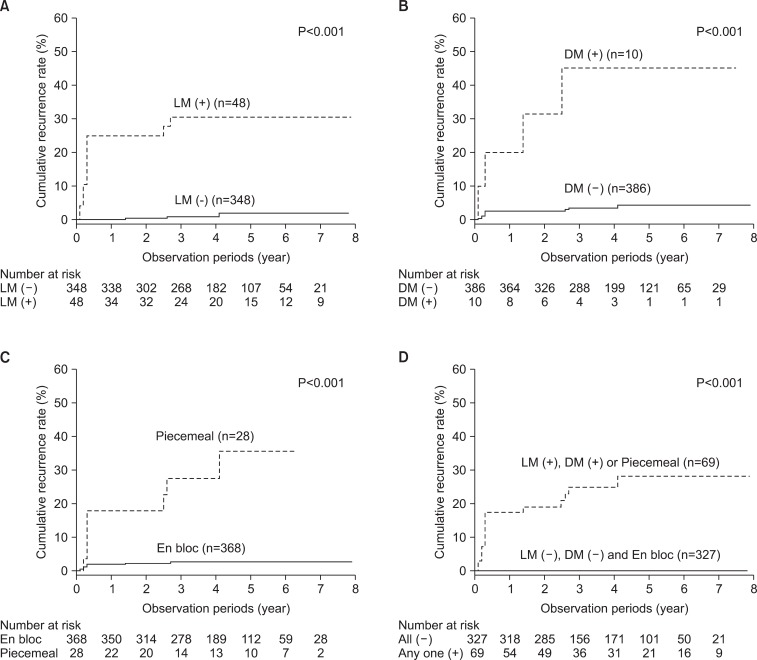
Fig. 3.
Kaplan-Meier plots in follow-up patients (n=396). Local recurrence rates according to the following risk factors. (A) Lateral resection margin status, (B) deep resection margin status, (C) piecemeal resection, (D) one or more risk factors. Log-rank test was used to evaluate the significance. LM (-) = free lateral resection margin; LM (+) = involved or uncheckable lateral resection margin; DM (-) = free deep resection margin; DM (+) = involved or uncheckable deep resection margin.

