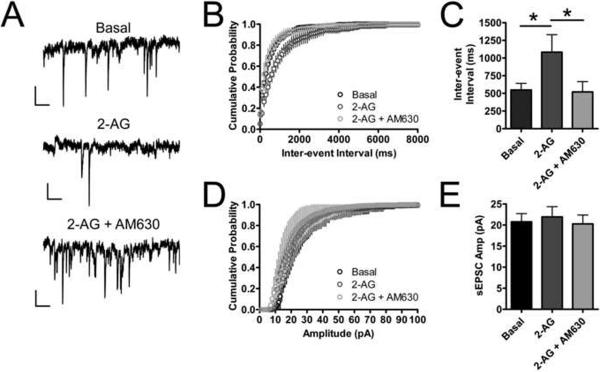
Fig. 4. CB2 activation decreases sEPSC frequency, but not amplitude suggesting a presynaptic site of action.
Spontaneous EPSCs (sEPSCs) were recorded from CB2 expressing neurons. Representative traces of sEPSCs recorded under (A) basal conditions, during 5 μM 2-AG treatment and during 5 μM 2-AG treatment with 1 μM AM630 present. Scale bars = 10 pA, 100 ms (B) Cumulative probability histogram of sEPSC frequency shows that the inter-event interval increases following 2-AG treatment and returns back to baseline when AM630 is applied. (C) Summary data for sEPSC frequency. (D) Cumulative probability histogram of sEPSC amplitude shows that 2-AG and AM630 do not alter the sEPSC amplitude. (E) Summary data for sEPSC amplitude. n=8 for all treatments. Data in (C) and (E) analyzed using one way ANOVA with Bonferroni's multiple comparison test. *: p<0.05 vs. 2-AG.

