
Figure 1.
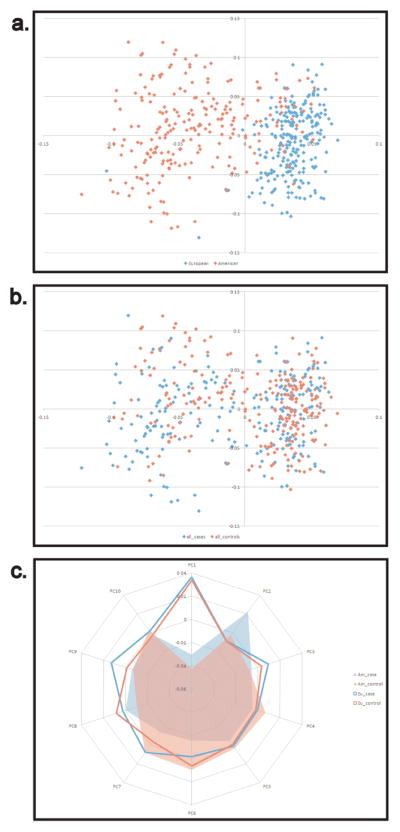
PCA of BMD populations from Europe and North America. PCs were calculated from whole genome SNP data in cases and controls from NA and Europe. a) Two distinct yet overlapping populations are identified when comparing North American (red) and European (blue) populations (Fst = 0.01). b) Cases and controls are distributed evenly throughout both populations (Fst=0.001). c) Only one of the top ten principal components differentiates cases from controls, all others divided the samples along continental lines. NA cases=red fill, NA controls=blue fill, European cases=red line, European controls=blue line.