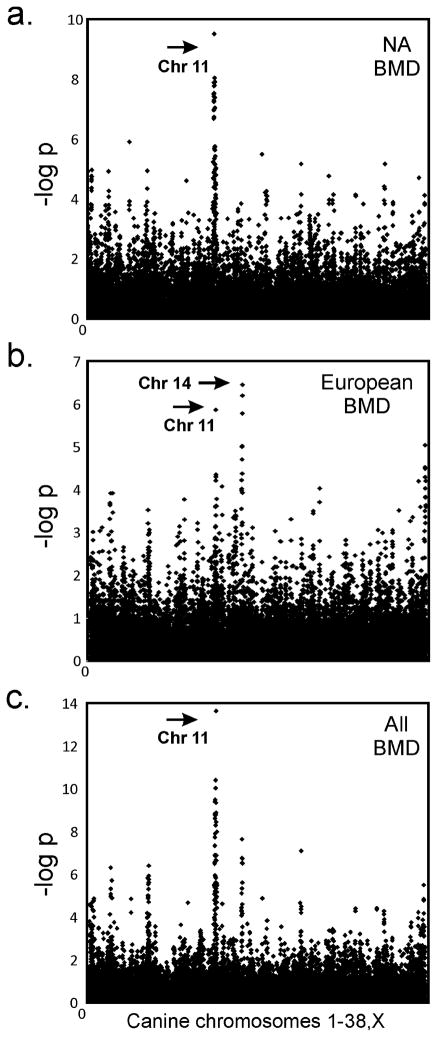
Figure 2.
Genome wide analyses of HS in two populations of BMD identify an association on CFA11. The Y-axis indicates the negative log of the uncorrected p-value. The X- axis shows marker position from the top of CFA1 through CFAX. a) 240 U.S. BMD with maximum association at CFA11 bp 41,359,032, praw=1.41 × 10−09. b) 234 European BMD with two peaks of association, CFA11 bp 47,179,346, praw=1.50 × 10⁻⁶ and CFA14, praw=9.80 × 10⁻⁸. c) U.S. and European cohorts combined for a total of 474 dogs with maximum association at CFA11 bp 47,179,346, praw=1.11 × 10⁻¹³. Additional peaks found on chromosomes 2, 5 and 20 are reduced to background levels after correcting for population structure.

