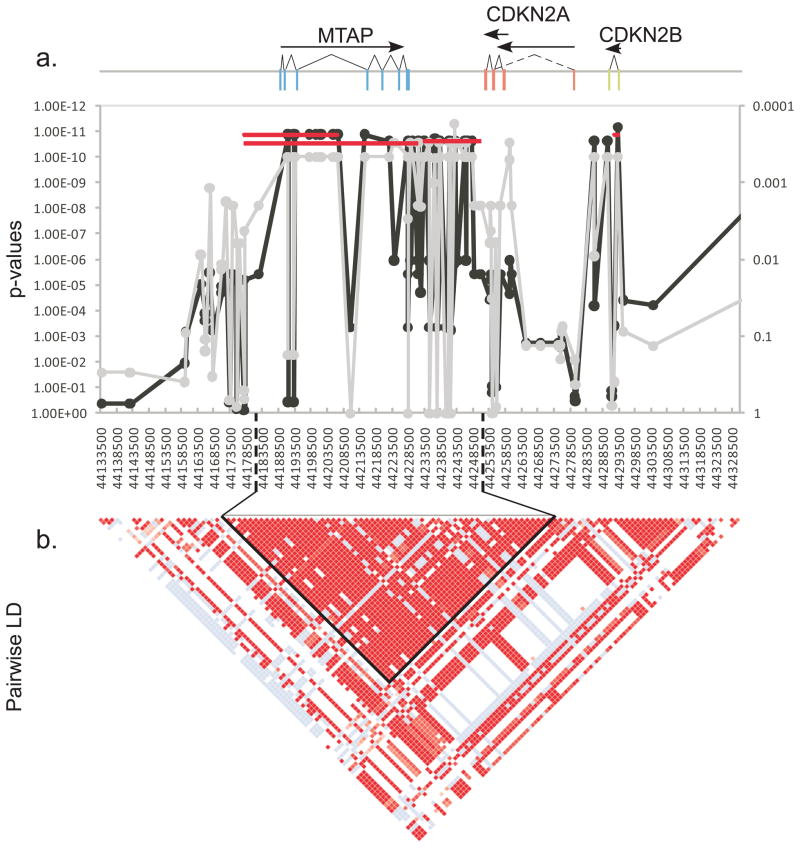
Figure 3.
A 75 kb region spanning the MTAP gene and continuing through the last exon of CDKN2A is highly associated with histiocytic sarcoma. A 195 kb region between CFA11 44,133,500 and 44,328,500 is shown. The X-axes for all plots list the SNPs in order from centromere to telomere. a) Positions of three genes are shown at the top of the graph. Exons are indicated as colored rectangles, introns are the connecting lines. Transcripts are indicated as arrows below gene names. Fisher’s exact association of allele frequency with HS is plotted along the Y-axis for each SNP. The gray line shows association in the discovery set of 24 cases and 20 controls with p-values on the right Y-axis. The black line shows association in the full dataset after imputation, with p-values on the left Y-axis. The red lines show association of the haplotypes across the region with the p-values in the left y-axis. b) Pairwise LD plot was calculated using Haploview. Solid red blocks indicate D′ =1 with a LOD score of 2. The haplotype block containing 28 of 30 equally associated SNPs is outlined in black. Another two SNPs form a short 3.4 kb haplotype in the CDKN2B region in perfect LD with the larger 75kb haplotype. Differences in p-values between the haplotypes are the result of a single crossover in a control dog.

