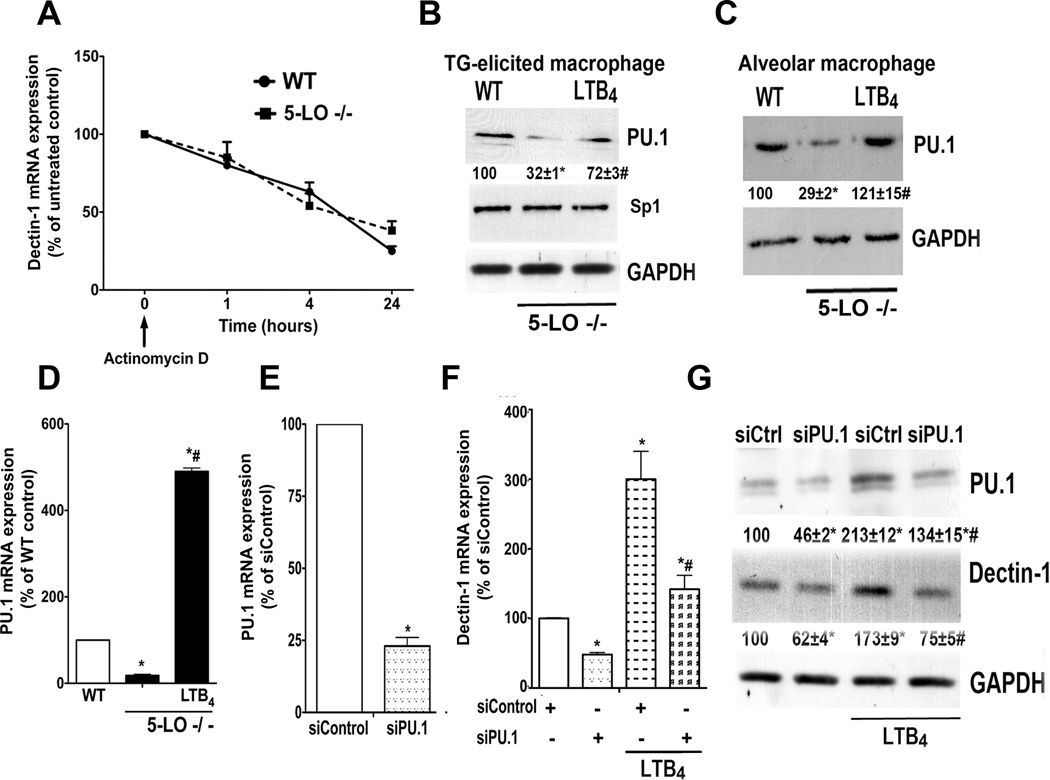
Fig. 4. PU.1 mediates LTB4-enhanced dectin-1 expression in macrophages.
(A) Dectin-1 mRNA decay in WT and 5-LO−/− macrophages harvested after treatment with actinomycin D (2.5 µg/ml). Data are from 3 experiments in triplicate; values are relative to untreated macrophages from both genotypes. (B) WT and 5-LO−/− elicited peritoneal macrophages or (C) resident alveolar macrophages were treated ± LTB4 for 24 h and the expression of PU.1, Sp1 and GAPDH were determined by immunoblotting. Numbers under lanes indicate relative density of PU.1 from three independent experiments. (D) PU.1 mRNA expression was determined by real-time RT-PCR in WT and 5-LO−/− elicited macrophages incubated ± LTB4 for 24 h. (E) WT macrophages were treated for 48 h in the presence of scrambled siRNA (siControl) or PU.1 siRNA, and the expression of PU.1 mRNA was determined by real-time RT-PCR and expressed relative to values in siControl cells. (F) Dectin-1 mRNA and (G) protein expression in WT macrophages treated with PU.1 and control siRNA, as determined by real-time RT-PCR and immunoblotting, respectively; mRNA levels are expressed relative to those in siControl-treated WT cells. Immunoblot is representative of 3 independent experiments. Numbers under lanes indicate relative density of dectin-1 or PU.1 from three independent experiments. Data represent the mean ± SEM from 3 individual experiments, each performed in triplicate. *p < 0.05 versus WT or WT siControl; #p < 0.05 versus 5-LO−/− control or LTB4-stimulated siControl macrophages by ANOVA

