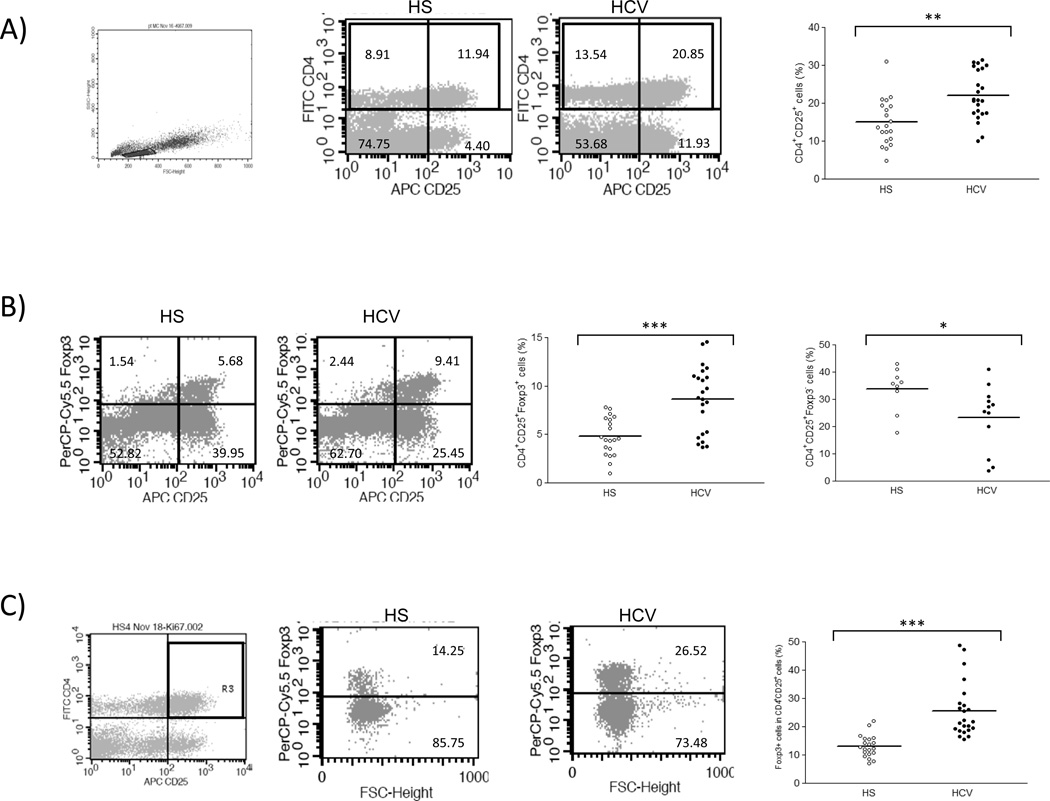
Fig. 1. Accumulation of CD4+CD25+Foxp3+ Tregs in chronic HCV infection.
A) Flow cytometric analyses of PBMCs from healthy subjects (HS) and chronically HCV-infected patients (HCV), stained with conjugated mAbs: FITC-CD4, APC-CD25, and PerCP-Cy5.5-Foxp3. The cells were first gated on lymphocyte populations and then further gated on CD4+ T cells, with frequency of cells in each quadrant indicated in the representative dot plots. Summary percentages of CD4+CD25+ T cells detected in the gated populations of HS and HCV is shown on the right panel. Each symbol represents a single individual, and the horizontal bars represent median values. The p value (**<0.01) is denoted above the group of studied subjects. B) Representative dot plots of Foxp3 expression in CD4+CD25+ T cell populations, gated based on isotype and FMO controls, in HS and HCV are shown on the left panel. Summary data for the difference of CD4+CD25+Foxp3+ Tregs and CD4+CD25+Foxp3− Teffs in HS versus HCV are shown on the right panels. *P< 0.05, ***P< 0.001. C) The relative frequency of Foxp3+ cells in CD4+CD25+ T cell populations. The cells were gated on CD4+CD25+ T cells, and the ratio of Foxp3+ cells in CD4+CD25+ T cells from HS and HCV are shown. ***P < 0.001.

