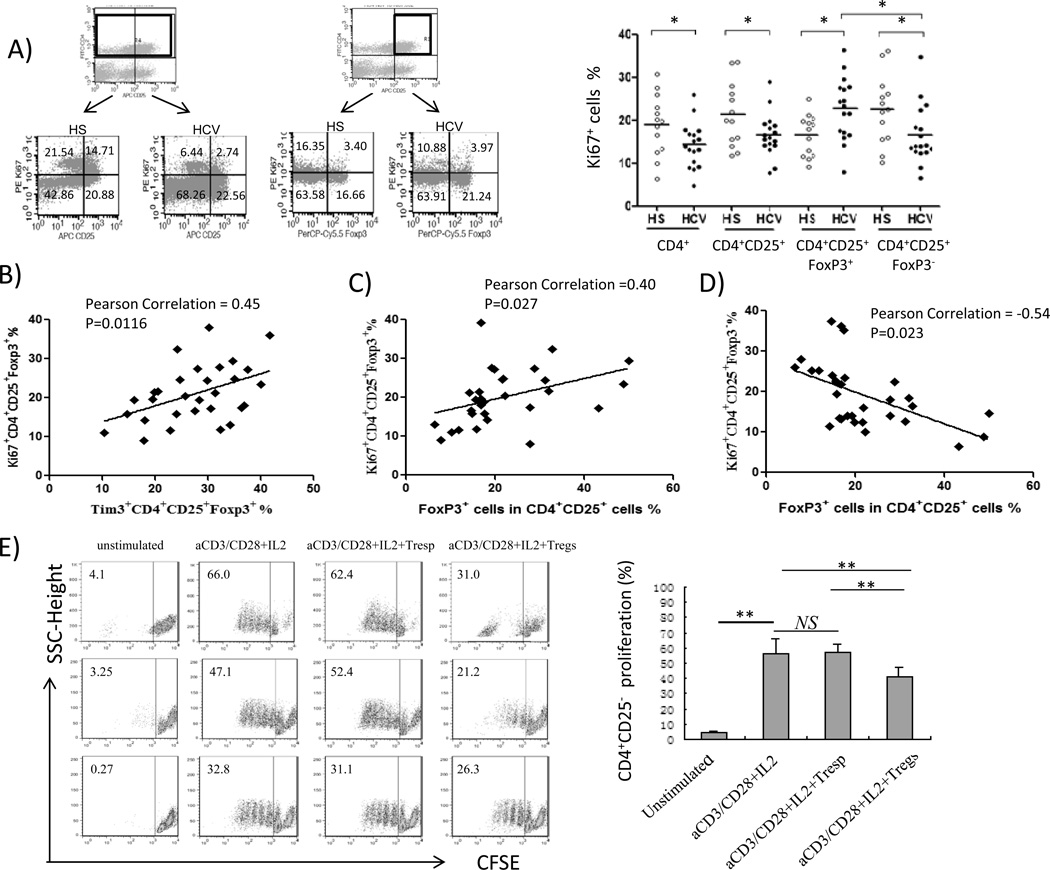
Fig. 3. Upregulation of Tim-3 on CD4+CD25+Foxp3+ Tregs positively correlates with the expression of Ki67 on Tregs in chronic HCV infection.
A) Flow cytometry analyses of PBMCs from HS and HCV, stained with conjugated mAbs: FITC-CD4, APC-CD25, PerCP-Cy5.5-Foxp3, and PE-Ki67. The cells were gated on CD4+ and CD4+CD25+ T cells with frequency indicated in each quadrant of representative dot plots; and summary data of Ki67 expression on CD4+, CD4+CD25+, CD4+CD25+Foxp3+ Tregs, and CD4+CD25+Foxp3− Teffs detected in HS and HCV are shown on the right. Each symbol represents a single individual, and the horizontal bars represent median values. *P<0.05. B) The correlation analysis between Ki67 and Tim-3 expressions in CD4+CD25+Foxp3+ Tregs in HS and HCV-infected individuals. Pearson correlation and P values are shown above. C) Ki67 expression by CD4+CD25+Foxp3+ Tregs positively correlated to the frequency of Foxp3 expression by CD4+CD25+ cells. D) Ki67 expression by CD4+CD25+Foxp3− Teffs inversely correlated with Foxp3 expression by CD4+CD25+ Tregs. E) Functional analysis of CD4+CD25+ T cells in suppression of CD4+CD25− T cell proliferation. CD4+CD25− T cells were isolated from HCV-infected individuals, labeled with CFSE, and then stimulated without or with anti-CD3/CD28 + IL-2 alone and in co-culture with purified CD4+CD25− T responder cells (Tresp) or CD4+CD25+ Treg-containing cells (1:1 ratio) for 6 days, followed by analysis of CFSE dilution as a means to measure T cell proliferation. Representative dot plots of cells from three HCV-infected patients under various treatments are shown on the left panel, and summary data of CFSE-labeled T cell proliferation from 8 HCV patients are shown on the right. **P<0.01. NS=no significance.

