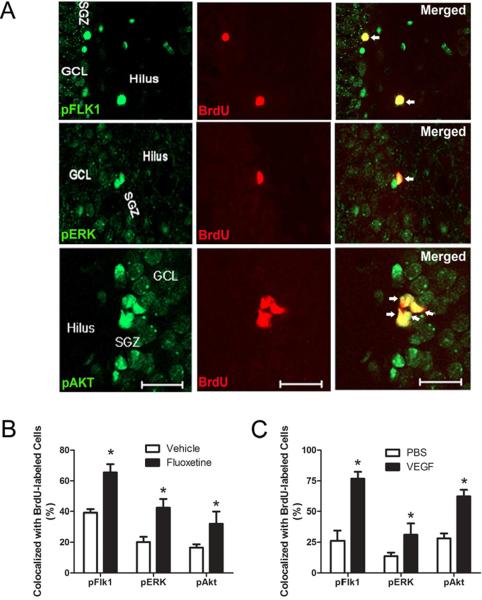
Figure 4. Phospho-activated forms of Flk-1, ERK, and Akt among proliferating cells.
(A) Representative photomicrographs showing phosphorylated forms of Flk-1, ERK, and Akt of BrdU-cells located in the dentate SGZ. pFlk-1, pERK, pAkT (green) and BrdU (red). Scale bar: 50 μm (pFlk-1, pERK) and 10 μm (pAkt). (B) Quantitative analysis showing the percentage of BrdU-labeled cells co-expressing pFlk-1, pERK, and pAkt after VEGF or PBS microinfusion. Student t-test: * P < .05 vs. PBS controls. (C) Quantitative analysis showing the percentage of BrdU-labeled co-expressing pFlk-1, pERK, and pAkt after chronic fluoxetine or vehicle treatment (representative images are from fluoxetine treated rat brains). Student t-test: * P <.02 vs. Vehicle. Error bars denote mean ± SEM

