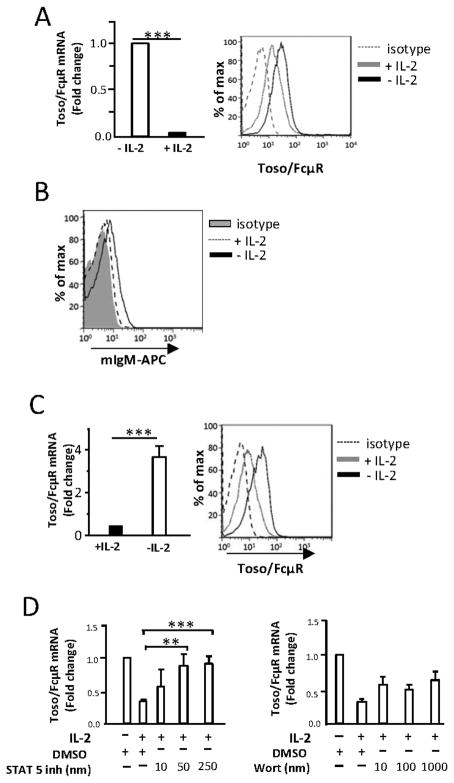
Figure 3. Toso/FcμR expression in primary human NK cells.
A, NK cells were cultured with or without IL-2 (500 U/ml) for 48 h. Toso/FcμR mRNA levels were measured by real-time PCR (left) and Toso/FcμR surface expression measured by flow cytometry using anti-Toso mAb or isotype control (mIgG2b) followed by PE-conjugated anti-mouse IgG Ab (right). The histogram is representative of results obtained from 10 donors and the bar graph shows the average. Error bars indicate SEM. B, NK cells were cultured in X-Vivo medium with Ig-depleted serum and IL-2 (500 U/ml) for 8 d (+ IL-2), or with Ig-depleted serum and IL-2 for 7 d then without IL-2 overnight (− IL-2). Cells were tested for IgM binding by adding mIgM-APC. The histogram is representative of NK cells from 12 donors. C, NK cells were cultured for 7 d with IL-2 (500 U/ml), washed, and resuspended in medium with or without IL-2 (500 U/ml) for 16 h. Expression of Toso/FcμR mRNA levels (left) and cell surface Toso/FcμR (right) are shown. The histogram is representative of results from 5 donors and the bar graph shows the average. Error bars indicate SEM. Statistical analysis was done by two tailed unpaired student’s t-test. *p<0.001. D, Freshly isolated NK cells were preincubated for 30 min with the STAT5 inhibitor or the PI3K inhibitor (wortmannin) at the indicated concentrations before adding IL-2. After 24 h, the cells were harvested and analyzed for Toso/FcμR mRNA levels. mRNA levels were normalized to 18S rRNA transcripts and presented as fold change relative to DMSO-treated cells. Data shown is relative Toso/FcμR mRNA expression from 3 donors and the error bars indicate SEM. Statistical analysis was performed using two-tailed unpaired student’s t-test. *p<0.05, **p<0.01.

