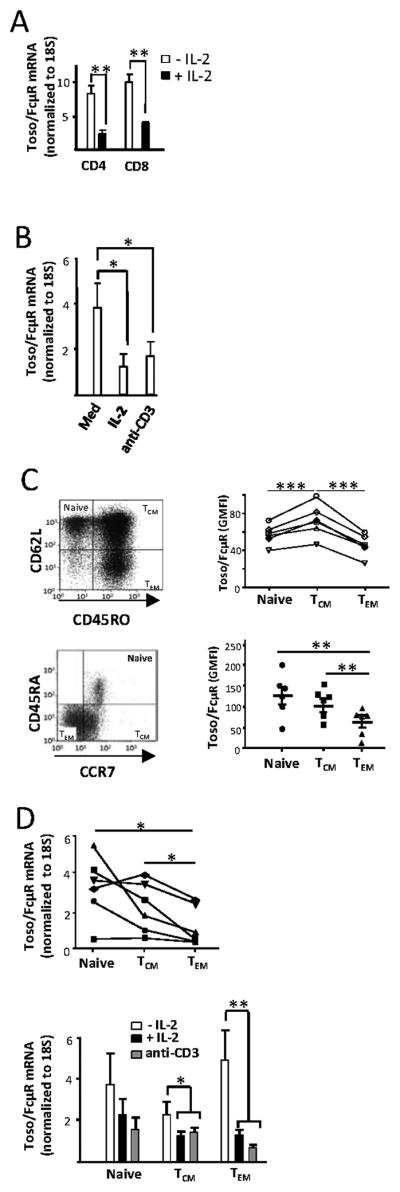
Figure 4. Regulation of Toso/FcμR expression on human CD4 and CD8 T cells.

A, Human peripheral blood CD4 and CD8 T cells were isolated and cultured in the presence or absence of IL-2 (100 IU/ml) in complete IMDM overnight and Toso/FcμR mRNA expression was quantified by real-time PCR. The results shown are from 4 donors and error bars indicate SEM. Statistical analysis was done by two tailed unpaired student’s t-test. **p<0.01. B, Human CD4 T cells isolated from PBMC were cultured with plate bound anti-CD3 mAb (1 μg/ml) or IL-2 (100 IU/ml) for 24 h and analyzed for Toso/FcμR mRNA levels by real-time PCR assay. Data shown are from 5 independent experiments and the error bars indicate SEM. Statistical analysis was done by two tailed unpaired student’s t-test. *p<0.05. C, Human CD4 T cells from PBMC were stained for CD45RO and CD62L (top), or CCR7 and CD45RA (bottom), and the cell surface expression of Toso/FcμR in the naïve and memory subsets defined by these markers was determined by staining with anti-Toso/FcμR mAb followed by PE-conjugated anti-mouse secondary Ab. Data shown are geometric mean fluorescence intensity (GMFI) of anti-Toso mAb staining for 6 individual donors, each represented by a symbol on the scatter plot. D, top panel, Human CD4 T cells isolated from peripheral blood were stained for CD45RO and CD62L and the naïve and memory subsets were sorted by FACS. The expression of Toso/FcμR mRNA levels were analyzed by real-time PCR and the data are normalized to 18S rRNA expression. Data shown are mean values of triplicates from 6 individuals each represented by a symbol on the scatter plot. Statistical analysis was done by two-tailed paired t-test. D, bottom panel, Sorted cells were stimulated with plate-bound anti-CD3 mAb (1 μg/ml) or IL-2 (100 U/ml) and analyzed for Toso/FcμR expression by real-time PCR (after 24 h). Data shown is from 7 independent experiments and the error bars indicate SEM. Statistical analysis was done using two-tailed unpaired student’s t-test comparing each treatment to untreated samples (−IL2).
