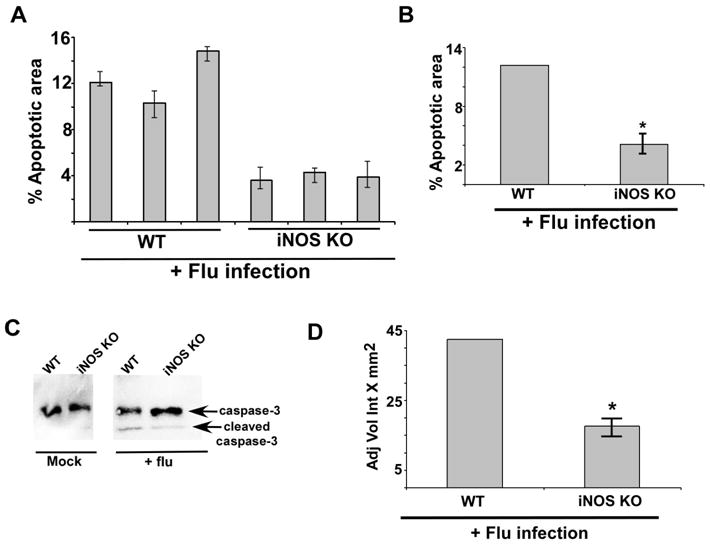
FIGURE 7.

iNOS expression is required for optimal apoptosis in the lung of flu infected mice. (A) For each experimental group lung sections were prepared from three flu infected WT mice and three flu infected iNOS KO mice. The lung sections were used for TUNEL staining. Image J software was used to calculate TUNEL-positive areas (representing apoptosis) in the lung sections as detailed in the methods section. The data is presented as percent apoptotic area. In the figure, each bar represents each infected animal and the values represent the mean ± standard deviation for the percent apoptotic area calculated from nine areas of the lung sections. (B) The values were compiled to calculate the percent apoptotic area in flu infected WT mice vs. iNOS KO mice. The experiment was repeated twice in duplicate. *p = 0.0289 by Student’s t test. (C) Lung homogenate prepared from flu infected WT and iNOS KO mice were subjected to Western blot analysis with anti-caspase-3 antibody. The un-cleaved full-length caspase-3 (35 kDa) and the cleaved caspase-3 product (19 kDa) are indicated by an arrow. (D) For each experimental group lung homogenate was prepared from flu infected WT (four mice) and iNOS KO (four mice) mice. Lung homogenate from each mouse [total=8 mice (WT=4 mice and iNOS KO=4 mice)] were subjected to Western blot analysis with anti-caspase-3 antibody to detect the cleaved caspase-3 product (19 kDa) as shown in Fig. 7C. The 19 kDa caspase-3 band from each infected mouse (total = 8 mice) was quantified by using the Syngene Genetools software and the band density was plotted to show difference in the levels of cleaved caspase-3 product in flu infected WT vs. iNOS KO mice. The band density is represented as adjusted volume intensity X mm2 (Adj Vol Int X mm2). The band density represents mean ± standard from two independent experiments performed in duplicate. *p < 0.05 by two-tailed t test
