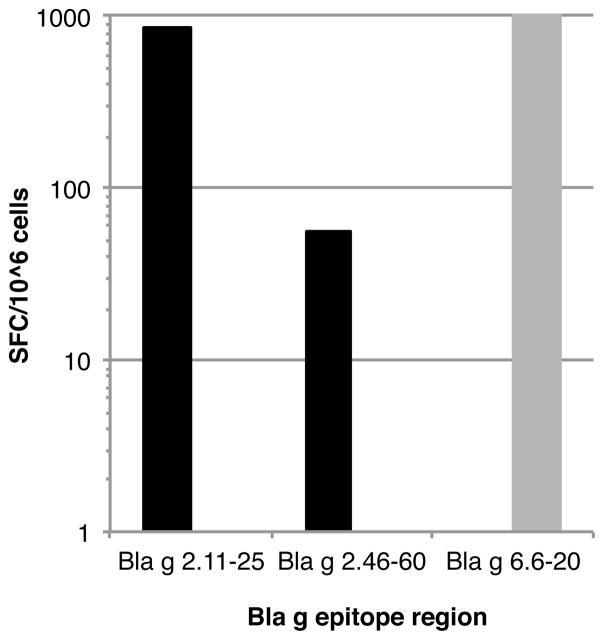
Figure 3. Polarized T cell responses to Bla g antigens within an individual donor.
T cell responses against Bla g allergens are differentially polarized at the level of individual donors. IFNγ (black bars) and IL-5 (gray bars) responses in donor U00023 to epitopes derived from Bla g 2 (epitope region 5, Bla g 2.11–25, and epitope region 7, Bla g 2.46–60) and Bla g 6 (epitope region 23, Bla g 6.6–20) are shown. The T cell response to Bla g 6 was associated only with only IL-5 production, while the response to the two Bla g 2 epitopes was only associated with IFN-γ.

