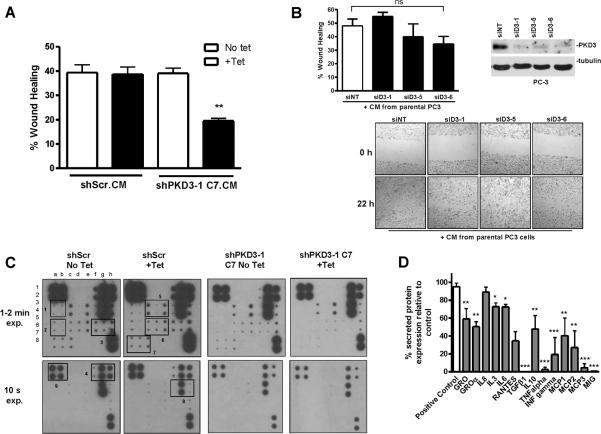
Figure 4. PKD3 knockdown modulates PC3 cell migration and secretion of various cytokines.
A, Conditioned media (CM) from equal numbers of shScr or shPKD3-1 C7 cells was applied to confluent parental PC3 cells that had been “wounded”. Cell migration was measured by wound healing assay. Representative data from 1 of 3 independent experiments are shown. **, p < 0.01. B, CM from parental PC3 cells rescued PKD3 knockdown-induced inhibition of cell migration. PC3 cells were transiently transfected with siNT, siPKD3-1, siPKD3-5, or siPKD3-6. Two days later, the cells were replated at equal high densities. After overnight attachment, cells were treated with 0.5 μM mitomycin C for 2 h and “wounded”. The medium was then replenished with equal amounts of conditioned media collected from parental PC3 cells after 48 h of culture in serum-free medium in the presence of 3 nM mitomycin C. Wound healing assay was then performed as described in the “Materials and Methods.” Representative data from 3 independent experiments are shown. ns, not significant. C, PKD3 knockdown reduces cytokine secretion. Conditioned media from equal numbers of shScr or shPKD3-1 C7 cells was subjected to cytokine antibody array. Chemiluminescent detection of protein spots for each of the samples is shown. Boxes indicate spots corresponding to the following cytokines (left to right in vertical duplicate): Box 1, IL-1α, IL-2; Box 2, IL-13, IL-15; Box 3, MCP-3, MIG, RANTES; Box 4, GM-CSF, GRO, GROα; Box 5, IL-3, IL-5, Il-6; Box 6, INF-γ, MCP-1, MCP-2; Box 7, TGF-β1, TNF-α, TNF-β; Box 8, IL-7, Il-8, IL-10; Box 9, internal positive control. See Supplemental Figure S4 for an array map. D, Densitometry analysis of the cytokine array. The value for each spot was normalized to internal positive control spots on the array. The relative percent expression was determined for both shScr– vs. shScr+ and shPKD3-1 C7– vs. shPKD3-1 C7+, and the relative percent change in expression for shScr+ vs. shPKD3-1 C7+ was plotted. *, p < 0.05; **, p < 0.01; ***, p < 0.001.

