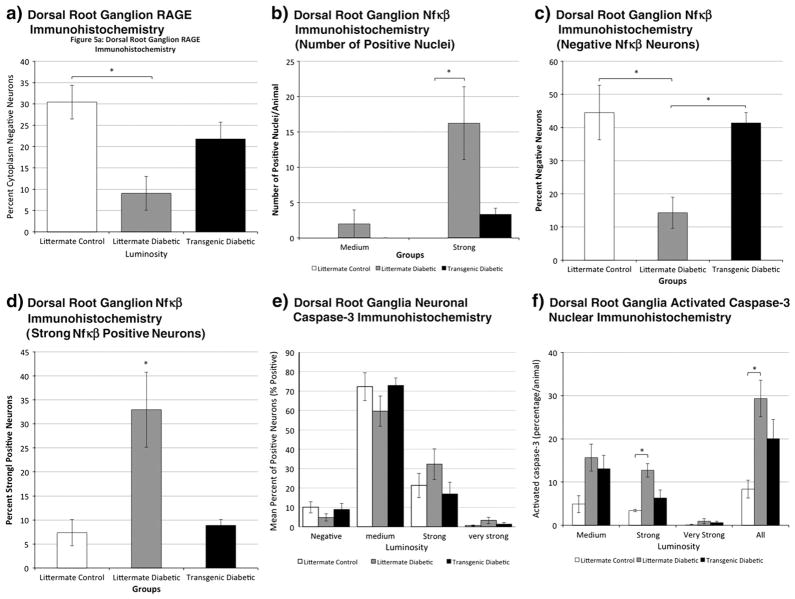
Fig. 5.
Analysis of dorsal root ganglion neuronal immunohistochemistry at 6 months of diabetes for control nontransgenic (littermate), diabetic nontransgenic (littermate) and diabetic transgenic mice. Luminosity intensity in neurons considered to have positive expression was further into medium, strong and very strong categories using arbitrary but standardized criteria (see methods). a. RAGE immunohistochemistry at 6 months of diabetes. Significant relative protection in the transgenic diabetic group against cytoplasmic expression within DRG neurons in comparison to littermate diabetics was observed (p<.05 (*); 1-way ANOVA with post-hoc Tukey HSD test; n=5 littermate control, n=5 littermate diabetic, n=4 transgenic diabetic). b. Nuclear NF-κB immunohistochemistry indicated relative protection in the transgenic diabetic group against strong nuclear expression in comparison to littermate diabetics (p<.05 (*); 1-way ANOVA with post-hoc Tukey HSD test; n=3 littermate control; n=4 littermate diabetic; n=3 transgenic diabetic). c. NF-κB immunohistochemistry also indicated relative protection in the transgenic diabetic group against neuronal NF-κB expression in comparison to littermate diabetics observed by analyzing the percentage of negative neurons (p<.05 (*); 1-way ANOVA with post-hoc Tukey HSD test; n=3 littermate control; n=4 littermate diabetic; n=3 transgenic diabetic). d. Overall high intensity (strong positive) NF-κB immunohistochemistry indicated that littermate diabetic mice had a substantial proportion of neurons with measurements of fluorescence intensity in the ‘strong’ range whereas transgenic littermates had results comparable to nondiabetic controls (p<.05 (*); 1-way ANOVA with post-hoc Tukey HSD test; n=3 littermate control; n=4 littermate diabetic; n=3 transgenic diabetic). e. Neuronal activated caspase-3 cytoplasmic expression by percentage of positive neurons was not significantly different among the groups (n=3 littermate control; n=5 littermate diabetic; n=3 transgenic diabetic). f. Nuclear activated caspase-3 immunohistochemistry at 6 months of diabetes indicated that diabetic mice had a higher percentage of labelled nuclei than nondiabetics (p=0.018 (*); ANOVA with post-hoc Tukey; n=3 littermate control; n=5 littermate diabetic; n=3 transgenic diabetic). There was blunting of its expression in transgenic diabetic mice, with expression values not significantly different than controls.

