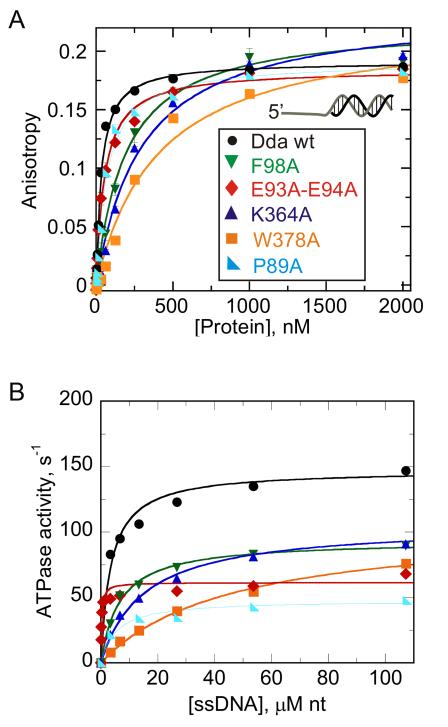
Figure 4. DNA binding and single-stranded DNA-stimulated ATPase activity.
(A) Binding was measured by using fluorescence anisotropy of F-dT7:16bp DNA duplex in the presence of wild type Dda, F98A, E93A/E94A, K364A, W378A, and P89A. Data were fit to the quadratic equation to obtain KD values (listed in Table 2). (B) ATP hydrolysis of wt and mutant forms of Dda were measured using a coupled spectrophotometric assay in which ATP hydrolysis is coupled to oxidation of NADH through the enzymes pyruvate kinase (PK) and lactate dehydrogenase (LDH). Rates of hydrolysis were determined in the presence of increasing concentrations of denatured calf thymus DNA. Data were fit to a hyperbola to obtain ATPase constants kcat and Kact where the latter constant is the concentration of denatured calf thymus DNA (in nucleotides) needed to reach half the maximum ATP hydrolysis rate (listed in Table 2). See also Figure S1.

