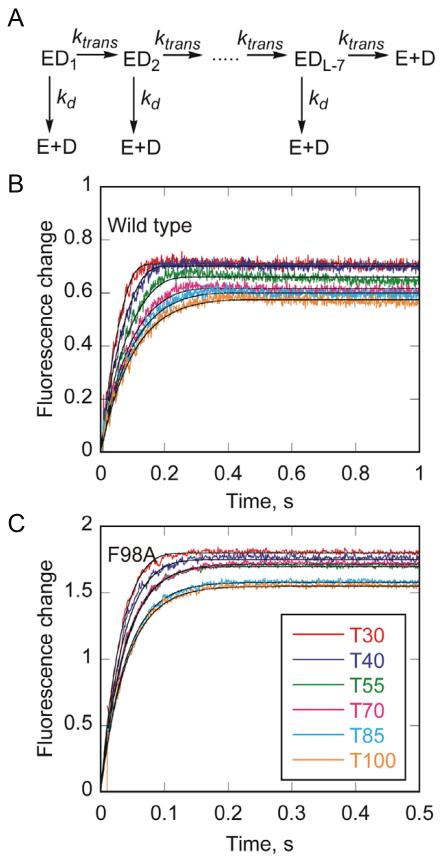
Figure 6. ssDNA translocase activity.
(A) A translocation scheme was used to fit data from DNA translocation experiments using KinTek Explorer (Johnson et al., 2009). The enzyme was equally distributed among all DNA binding sites (ED1 to EDL-7) where L is the length of ssDNA to allow for random binding to the substrate and account for the binding site size of 8 nucleotides based on the structure. The enzyme can translocate on the substrate in a series of identical steps, defined by rate constant (ktrans). At each step, the enzyme can also dissociate from the substrate with rate constant kd and bind to the dextran sulfate trap. (B) Change in fluorescence of Dda upon dissociation of wild type Dda from T30, T40, T55, T70, T85, and T100 oligonucleotides. Enzyme and DNA were pre-incubated, and the reaction was initiated by mixing with ATP, and dextran sulfate. Data were fit to the mechanism shown in (A). The rate constants for translocation and dissociation are 233 ± 27 nt/s and 5.75 ± 1.60 s−1, respectively. (C) Change in fluorescence upon dissociation of F98A Dda from T30, T40, T55, T70, T85, and T100 oligonucleotides. Enzyme and DNA were pre-incubated, and the reaction was initiated by mixing with ATP and dextran sulfate. Data were fit to the mechanism shown in (A). The rate constants for translocation and dissociation are 249 ± 23 nt/s and 20.4 ± 2.3 s−1, respectively. See also Figure S3.

