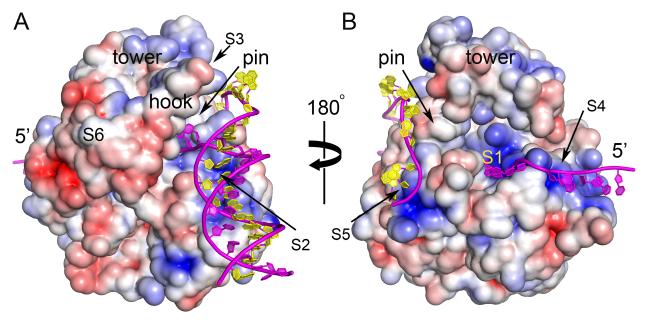
Figure 7. Surface electrostatic potential of Dda and substrate binding.
(A) The view corresponding to Figure 1A and (B) is rotated by 180°. Blue is positive potential, red is negative and white is neutral/hydrophobic (±5 kT/e electrostatic potential). Key surfaces are labeled S1-S6. S1 engages the translocating strand. S2 and S3 are putative alternate binding sites for the incoming duplex. S4 and S5 are putative binding sites for the exiting translocated strand and the displaced strand, respectively. S6 is a conserved hydrophobic patch on the SH3 domain that is well positioned to bind T4 UvsX and/or gp32. Superimposed on the figure is a model of the full DNA substrate based on these sites. S2 is preferred over S3 for binding the duplex in this model. See also Movie S1.

