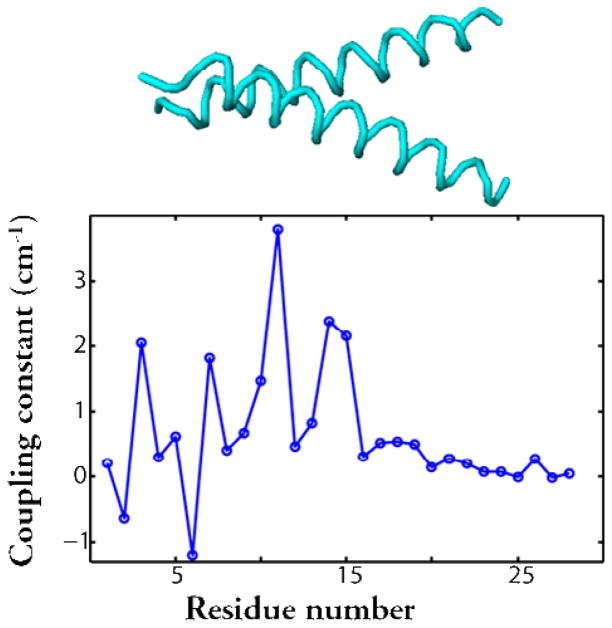
Figure 2.
The Glycophorin A dimer presents significant coupling only in the crossing region. The upper portion sketches the helix dimer with the spacing of the residues matching the scale on the bottom portion. The lower portion indicates the residue dependence of the tertiary coupling constants obtained by methods described in the text.

