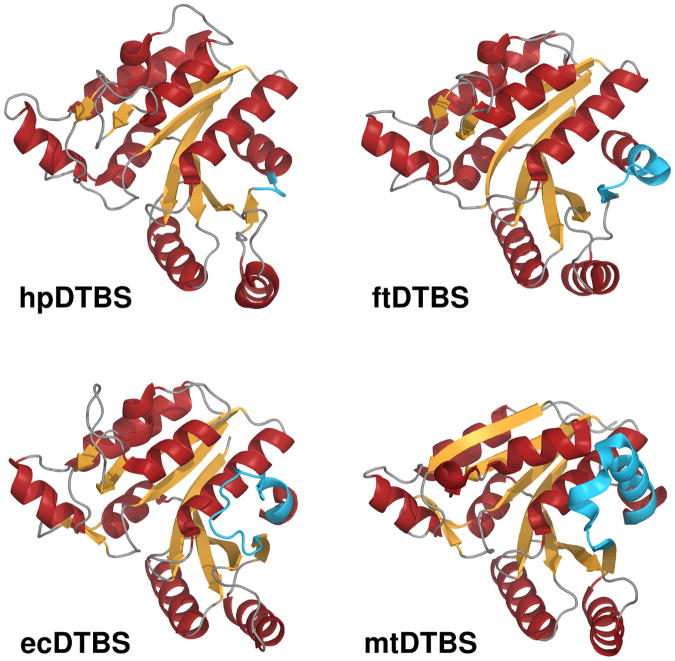
Figure 3. Overview of superposed DTBS structures.
Comparison of the structures of hpDTBPS (2QMO), ftDTBS (3OF5), ecDTBS (1BYI) and mtDTBS (3FGN), in cartoon representation with α-helices rendered in red and β-strands rendered in orange. The C-terminal fragments responsible for nucleoside binding contributing to differences between these DTBSes are shown in blue. See also Figure S2 for comparison of nucleotide binding surfaces.

